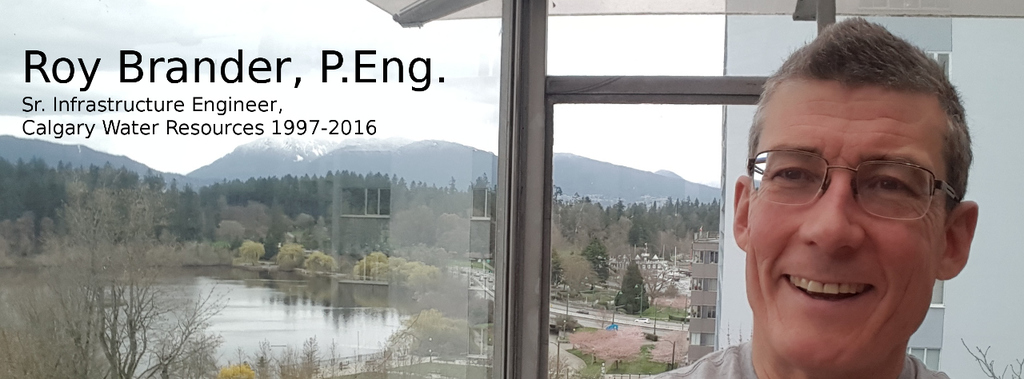
Yes, that's the actual view from our place. It's quite compact, but it really has location, location, location.
ADDRESS:
402 1972 Robson St.
Vancouver
British Columbia
V6G 1E8
604-704-1527 mobile
604-681-2002 home landline
"Dora's Page": A daily photoblog.
Just a few photos a day to stay in touch with Calgary family.
Latest Post: September 20
Covid Cup Colour Commentary
Pandemic Blog, was daily April 1, 2020- April 1, 2023. No longer daily.
Latest Post: August 10 - a study has found 'What Worked' in the pandemic!
CCCC archive for its first two years, April Fool's 2020-2022.
Have a look at our much-cheaper, safer, easier-to-repair "Modular Kitchen".
My career allowed me to provide the neighbours with some information and explanations, and speak up for us when Global News called.
My mother's instructions on this, and examples, were given over and over again; fudge is hard to get right. I came to realize the "oral tradition" was part of the heirloom, passed down for five generations.
Fudge is tricky. Good luck. You'll need it.
Volumes 1-6 are now up at link above. Volume 7 is small, should be out this year, and get us to 1917. And marriage!
It took about 20 years, but I finally developed a statistical model that would predict the likely number of main-breaks for the next year of a water pipe; a model that could be applied across an entire pipe database to give a risk, in dollars-per-metre, for each pipe, constantly. The database was then updated every night for risk levels, changed after every main break. It could then always print out a prioritized list for replacements.
Basically, I automated my own job of picking the yearly replacements by hand. My successor was able to expand her duties considerably, get out in the field more with the new inspection technologies. We co-wrote the paper on my model, delivered at the Western Canada Water and Wastewater Conference in Calgary, spring 2016, right after I retired.
PowerPoint file for "Calgary Water Main Break Prediction Model" All the speaking notes to go with each slide are included, so you can follow the whole presentation.
We started the program in 1998 and it still goes on, may now mostly be re-retrofitting anodes that wore out over 20 years, to keep the main going another 20. I estimated around 2015 that it had already averted a thousand main breaks, saved over 20 million repair dollars and a hundred million replacement dollars; by now, you can add a good third onto those numbers.
I never did do a public presentation about it - they were all internal, for my management. Here's a few slides I can show.
The last several years of that career, my job was expanded to sanitary and storm sewers, when the two departments merged. Having developed a general approach to the "risk of a main" problem for water pipes, I was able to find an equivalent for sewer pipes: a model where the various things in its history (video inspections, past repairs) could predict the risk of future dig-repair needs, future flushing needs, and prioritize by risk. That model needed a lot more consideration of the "consequences" of failure, much higher if sewage spills into the environment than the street. A new engineer-in-training worked on that, under me, and we did a paper at the same conference about the equivalent sanitary-sewer risk model and rehabilitation priorities.
PowerPoint file for "Calgary Sanitary Sewer Risk Model", again including the whole speech.
I was pretty proud, though. I solved - for Calgary, at least - the Holy Grail of Asset Management: entirely automatic risk prioritization. Then I did it again, for a quite different asset class. Most utilities still make these decision entirely by "gut-feel", or by rules-of-thumb. I'd found our old rules-of-thumb to be very wrong, in the course of developing a scientifically-defensible replacement. The fact that I was able to do it again, in such a short time, shows that the methodologies I developed remain valid, despite the type of infrastructure; they are general principles.
Utilities around the globe, but especially where there is a lot of old infrastructure, are wasting billions per year on replacement by poor guesswork. The "infrastructure crisis" is bad, but not actually quite as bad as many engineers portray it; with good data and good decisions, with new inspection and rehabilitation technologies, we can get a lot more value out of old infrastructure than we think.
Others carry on with these models at The City of Calgary Water Resources, but I hope they find application across the industry.
The infrastructure-evaluation methodologies I developed were for whole asset types (all 50,000 water pipes, say) where you have limited information about them. Pipeline inspection technologies bring your information to a whole other level, allowing for near-certainty about the pipes inspected. It's where you go next when the statistical models indicate a concern.
Presentation to Ontario Waterworks Assocation, 2016
Powerpoint of my Presentation to the National Association of Trenchless Technologies 2019, Denver, CO
Powerpoint of my Presentation to the American Waterworks Conference Workshop on Water Pipe Management2019, Chicago, IL
(There's some overlapping material between the two).
It goes into how digital TV works, practical problems, copyright issues, and some (lame) humour about how bad TV has been over the years. It's a large expansion of my shorter blog post from a year before. That version is all you really need if casually interested in Over-The-Air TV options.
"How Resilient Are Our Vital Services in a Cyberwar?"
The group of tools can be commanded from one dialogue called SQLtools. That link is to documentation for how to use it, and download it.
Used in full, SQLtools will take a worksheet of data, and turn it into valid SQL INSERT statements, with all numeric formats clean, all text data quoted, and internal quotes doubled. It will also look at your data, and "AI" (well, several clever IF statements) will guess at an Oracle CREATE TABLE statement that will create a table with right data types and data-widths to hold your spreadsheet.
Other tools in TableWare just make Pivot Tables easier to copy, delete, flip around the graph axes. It was just handy for analysing tabular masses of data.
Information and Download Page for TableWare
Still very proud of my Retirement speech I gave for all five.