

|
| Index & Notes |
|
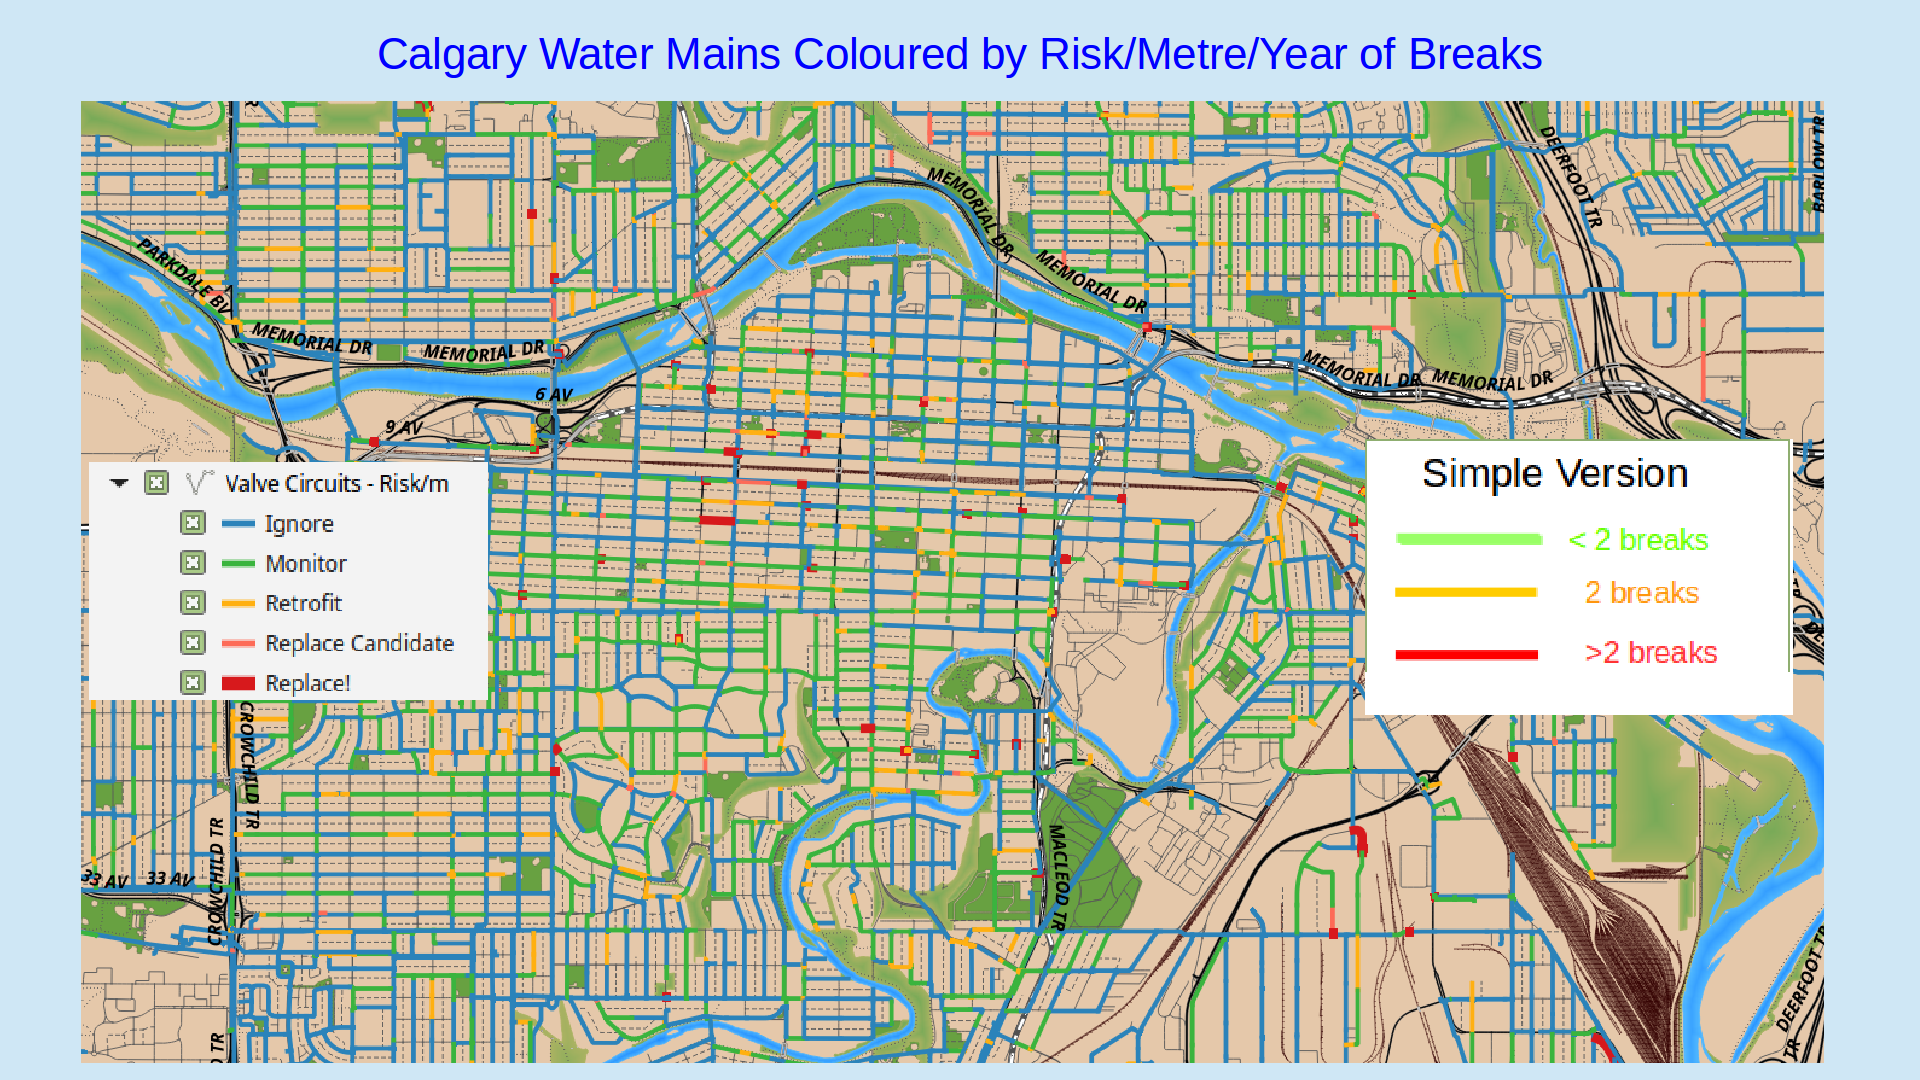
Calgary Water Valve Circuits Map coloured by Risk Level
We shop for mains to replace and retrofit each year with the full-city risk map, colouring the valve circuits by their risk number: you could see the potential replacement program in red and rehabilitation program in orange - or at least the best candidates to examine.
In red, barely a tenth of a percent of the system. In orange, nearly a whole percent..between them, just a few hundred mains each year that get any attention from a human being.
As the "simple version" of the legend indicates, it's usually the case that all my statistics boil down to "think about retrofit at 2 breaks, seriously consider replacement at three". You can start by just doing that after only five years of careful break-counting and mapping.
Then you can move forward to a reasonably-accurate probability-based system like this as soon as another five or ten years of record-keeping gives you enough cases to to build your own probability table. It will give you the statistics you need to justify the size of your program, too, tell your managers whether you have enough money. Until you get there, the rest of my discussion is about how to spend the money they give you on the most-likely mains by rules-of-thumb.
© Roy Brander, P.Eng 2016