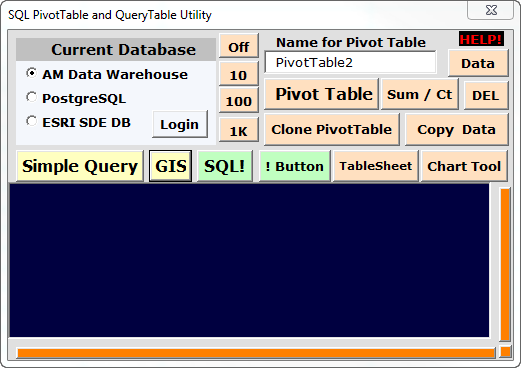
To create a Pivot Table, or just do a query:
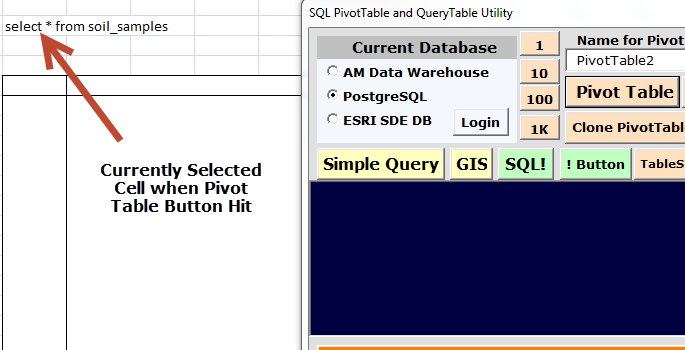
If the query is NOT still in the text box, (say, you reopen the worksheet later and bring up TableWare again), you can fill the text box with the query stored inside the table definition by selecting any cell inside the table and double-clicking on the black text-box field when it is blank. That will fill the text-box with the query, which you can then edit and double-click again to replace the existing one.

However, you cannot just change the SQL in the one cell, or in a range of cells, and refresh your Pivot Table. Once the Pivot Table (or Query Table) is created, the SQL that created it becomes part of the definition and does not change automatically. These are only ways to DISPLAY the original SQL that created the Pivot Table in your spreadsheet.
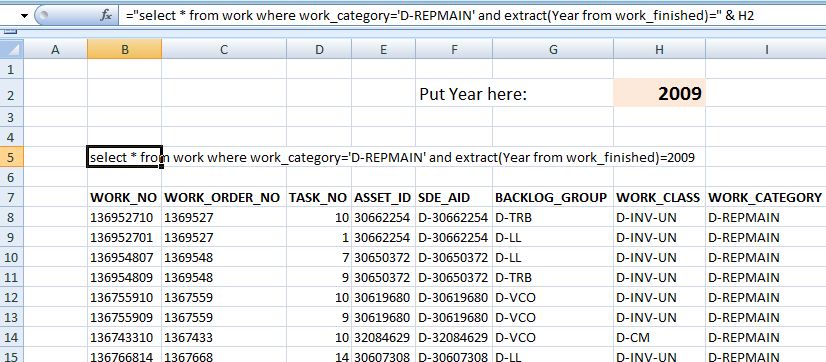
This technique is especially useful when combined with Excel text forumlas. The cell(s) containing the text of an SQL query can also be a formula like:
="SELECT * FROM WORK WHERE WORK_CATEGORY='D-REPMAIN' AND extract(year from work_finished)=" & H2
Creating a spreadsheet where you need only change the highlighted cell to change the query:
Of course, every time you change the year in cell H2, you must hit the green "SQL!" button on TableWare to update the pivot table with the changed SQL. If you need to give the spreadsheet to somebody who isn't likely to use TableWare, read the next section:

The Clone PivotTable will create a new sheet, with a new PivotTable in the same position on that sheet as the selected PivotTable is on the original sheet. This second PivotTable shares the same PivotCache, containing all the data from the last query, and reports can be done with it on that data, while leaving your existing PivotTable untouched...for when you need multiple reports from one query. This one does not apply to simple queries.
The Copy Data button just copies the DATA in your existing PivotTable to another sheet - it lets you keep a snapshot of a database as it was when you made the query, useful when the database is changing with time. Note that a copied PivotTable sharing the cache will CHANGE if you re-query, so you can lose a report that was itself a "snapshot" of the data at a given time.
The Flip Chart button is only used when you have added a PivotChart to your pivot table. (When any cell in the pivot table is selected, hit the PivotTable Tools button above the ribbon to get the ribbon with "PivotChart" on it.) Which table field is the rows and which is the columns often produces a chart with exactly the wrong axes; this button just toggles "X" for "Y" in the axes and gets the chart right, and can toggle it back again when you want to look at the table.
The Sum/Ct button flips summarization between the sum of numbers and the count of different values. When you drag in a field, Excel has a maddening way of assuming you want a COUNT of those fields when you want a SUM (say, of money or length), and vice-versa. This toggles any field you click on between "COUNT" and "SUM".
The DEL button just above "Sum/Ct". It just deletes any PivotTable you click on first when you hit it. Saves the effort of selecting the area around the PivotTable (including the Page field if used) and going through Edit/Clear/Clear-All in the menus.
The Data button just above DEL selects the whole Pivot Data range - all the "inner" cells. This makes it quick & easy to then hit formatting keys like "$" and "%" to change the number format. If the that area is ALREADY selected, it sets the whole area to the "GENERAL" (Excel Default) number format that shows the whole number. (There is, oddly, no button for this in Excel itself). If the format is already "General", then it changes it to the "Number" format with one decimal place, usually all that is useful. Further clicks just switch between general "123.0734", and one-decimal "123.1" formats.
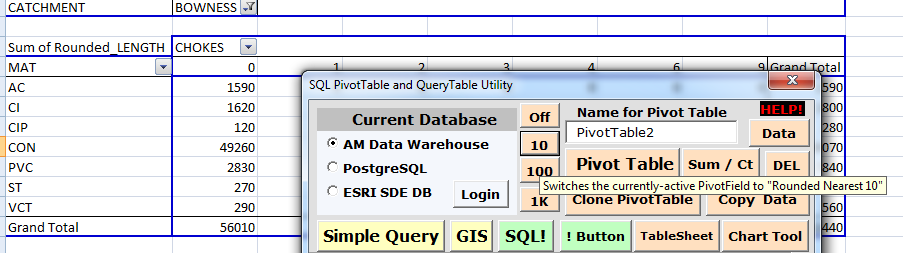
The Rounding Buttons are those just to the right of the database login (and just left of the big Pivot Table button). They say "Off","10","100","1K". These are used only when the data area is filled with a SUM rather than a count, say, the SUM of the LENGTH field in a pipe table to give the total length of pipe in each cell of the table. Frequently you get numbers like these:
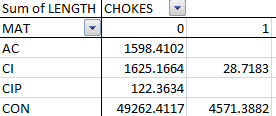
To round the values off, first click on any of the data cells, then click on 10, 100 or 1K to round it to the nearest 10, 100 or 1000 metres. Click on OFF to turn off rounding.
Same table with a data cell selected and 10 clicked
The GIS button just does something handy for ESRI user in particular. Often, a pivot table report may pull out a group of assets worth looking at on a map. ESRI layers have a tab called "Definition Query" where you might put in a string like:
MSLINK IN (37, 99, 159, 222)
...only the list might be very long.
Once a pivot table shows a group of query rows of some interest - say that there are 55 mains that are CON material and have choked 1 time:
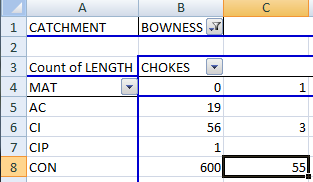
...then a double-click on Cell C8 with the "55" in it will jump to a new worksheet with all 55 records in it:
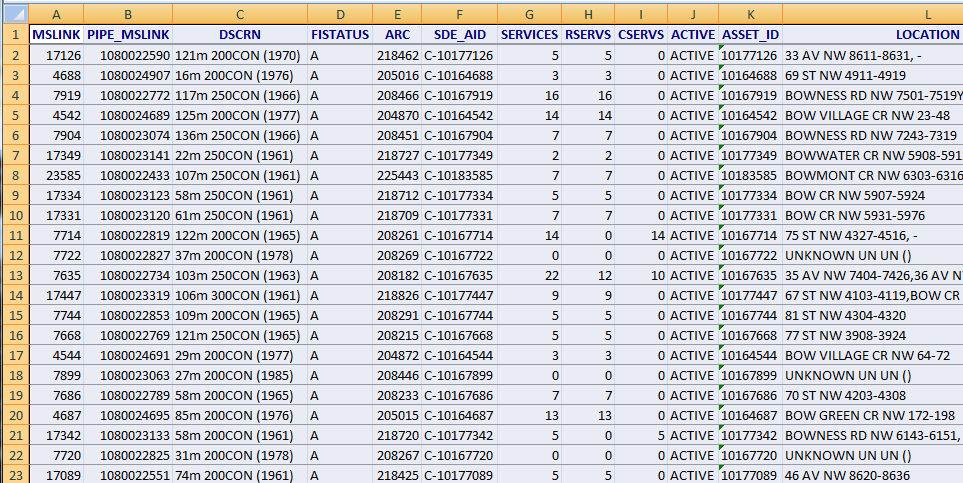
What the "GIS" button does, is if you click anywhere in column A of that sheet, and hit the GIS button, then TableWare will look at the column name at top, and the whole column and construct a string like this:
MSLINK in ( 17126, 4688, 7919, 4542, 7904, 17349, 23585, 17334, 17331, 7714, 7722, 7635, 17447, 7744, 7668, 4544, 7899, 7686, 4687, 17342, 7720, 17089, 7903, 17123, 7682, 7773, 7767, 4543, 17330, 23607, 7725, 7815, 7791, 61090, 7824, 17351, 7675, 7662, 7900, 17360, 17449, 7670, 7852, 17306, 7633, 17194, 19299, 7792, 7661, 7866, 7748, 7689, 7902, 23620, 7836)
...and it puts this string into the Windows "Paste Buffer". Just move your mouse over to the GIS program, the "Definition Query" tab, and Paste it. Your next refresh of the layer will show only the 55 mains that were of interest in your pivot table. NB:These "enumerated lists" in an SQL statement cannot exceed 1000 items. If you have more than 1000 things to highlight in the GIS, it would be better to put a specific query in the Definition Query tab.
Lastly, there are three buttons with no text at the bottom and right of the SQL query text box; they start off all Orange. Once you have a PivotTable and click within it anywhere, these buttons cycle the report through three report styles:
The tiny button at lower right just switches back & forth between two reports: normal data and "% of whole table".
For each of these three buttons, they also change colour to notify you of the current state, with these mnemonics:
Common errors are (1) wrong database and (2) SQL code errors - check them in Benthic Golden32 or other SQL tool. And remember that the format "07-13-1958" for dates may work in one tool but not in another - that one won't work here! To be sure, always use "to_date('07-13-1958','DD-MM-YYYY') or equivalent. CURRENTLY, the Oracle servers are set to the format "19580713" ('YYYYMMDD'), but some IT guy can change this at any time!
This tool does not have the 26 error checks that a commercial product would have. If your SQL is wrong or similar problem, it will simply die with an error message. Just close the dialogue and use the SQL button to pop it up again.
The HELP button at upper right brings up the help web page. You are reading it now. Thank you!