

|
| Index & Notes |
|
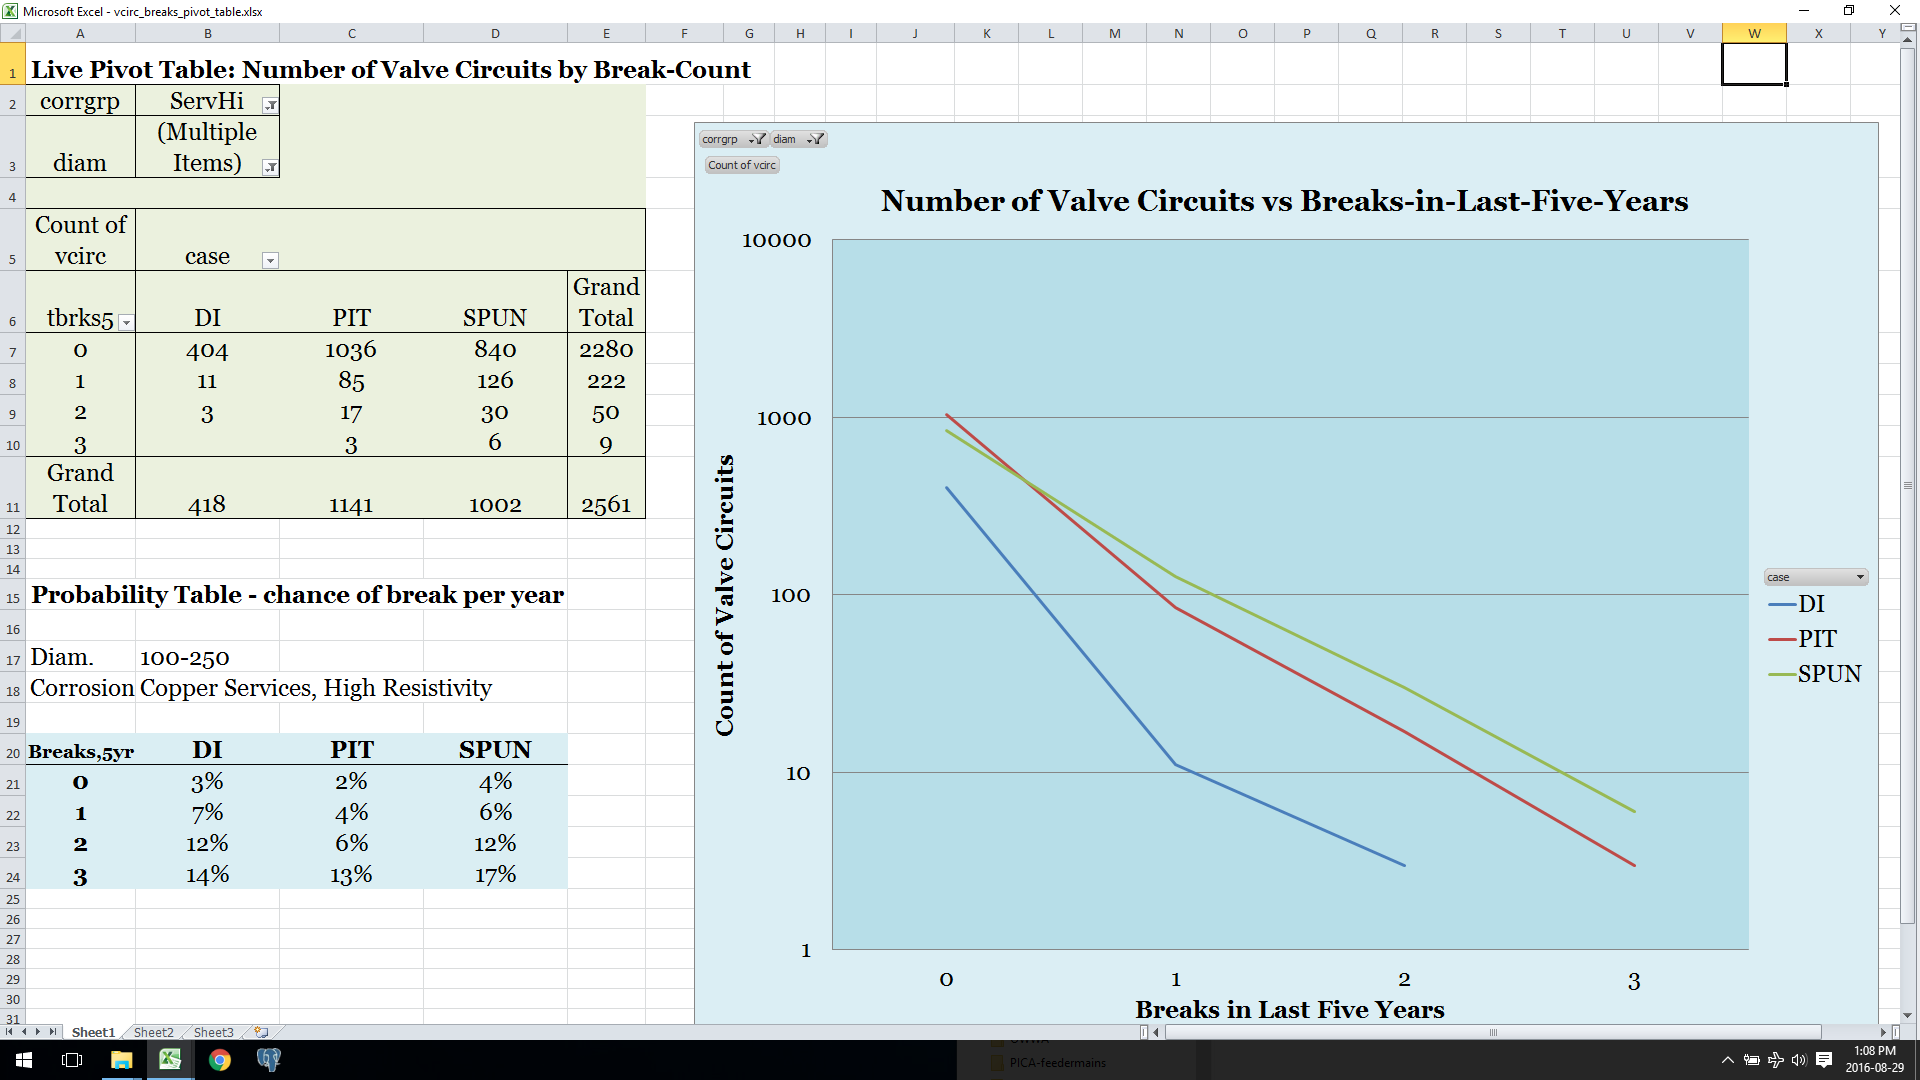
Pivot Table of Breaks and Probabilities
When you do the same graph again, counting blocks of main vs the number of breaks they've had - this time just breaks in the last five years, so the axis is just zero, one, two, or three - you still get power laws. There's a slightly different slope for each of DI, thin and thick-wall CI; different slopes again for different diameters and corrosion risk groups.
At the lower left, example probabilities for the case shown in the pivot table and pivot chart: for the group with 100mm-250mm diameter, with copper services but in high resistivity soils, meaning lower corrosion rate, for each of three material types. The power law is expressed in how the probability of a break next year goes up exponentially with number of past breaks, from 3% to 7% to 12%, nearly doubling each time - at three breaks, it levels off for DI but not CI, probably because DI responds better to our anodes; every city would have different probability tables depending on procedures like that, and of course their soil, and moisture.
So that table, four probabilities for each of 24-some groups, breaks the city into over ninety statistical bins and gives me a probable number of breaks next year on each valve circuit. Multiply by the TBL cost of a break, and you have risk in dollars on each valve circuit.
© Roy Brander, P.Eng 2016