 Good morning, I'm Roy Brander, I was Senior Infrastructure Engineer for Water Resources, City of Calgary. I managed the replacement and rehabiliation programs for both water and sewer systems there until I retired last January. Funny thing, they refused to pay my way to conferences after that, so I appear today with the support of the PICA corporation. I've been a walking advertisement for their pipe inspection tools for nearly 20 years, because Calgary likes to go to conferences and brag about its successful projects, and our successes in inspection were also PICA's. So their CEO Dave Russell is now happy to pick up my airfare to see you today. I'll be mentioning Dave's fine products in the course of my talk, as I have for many years.
fullscreen
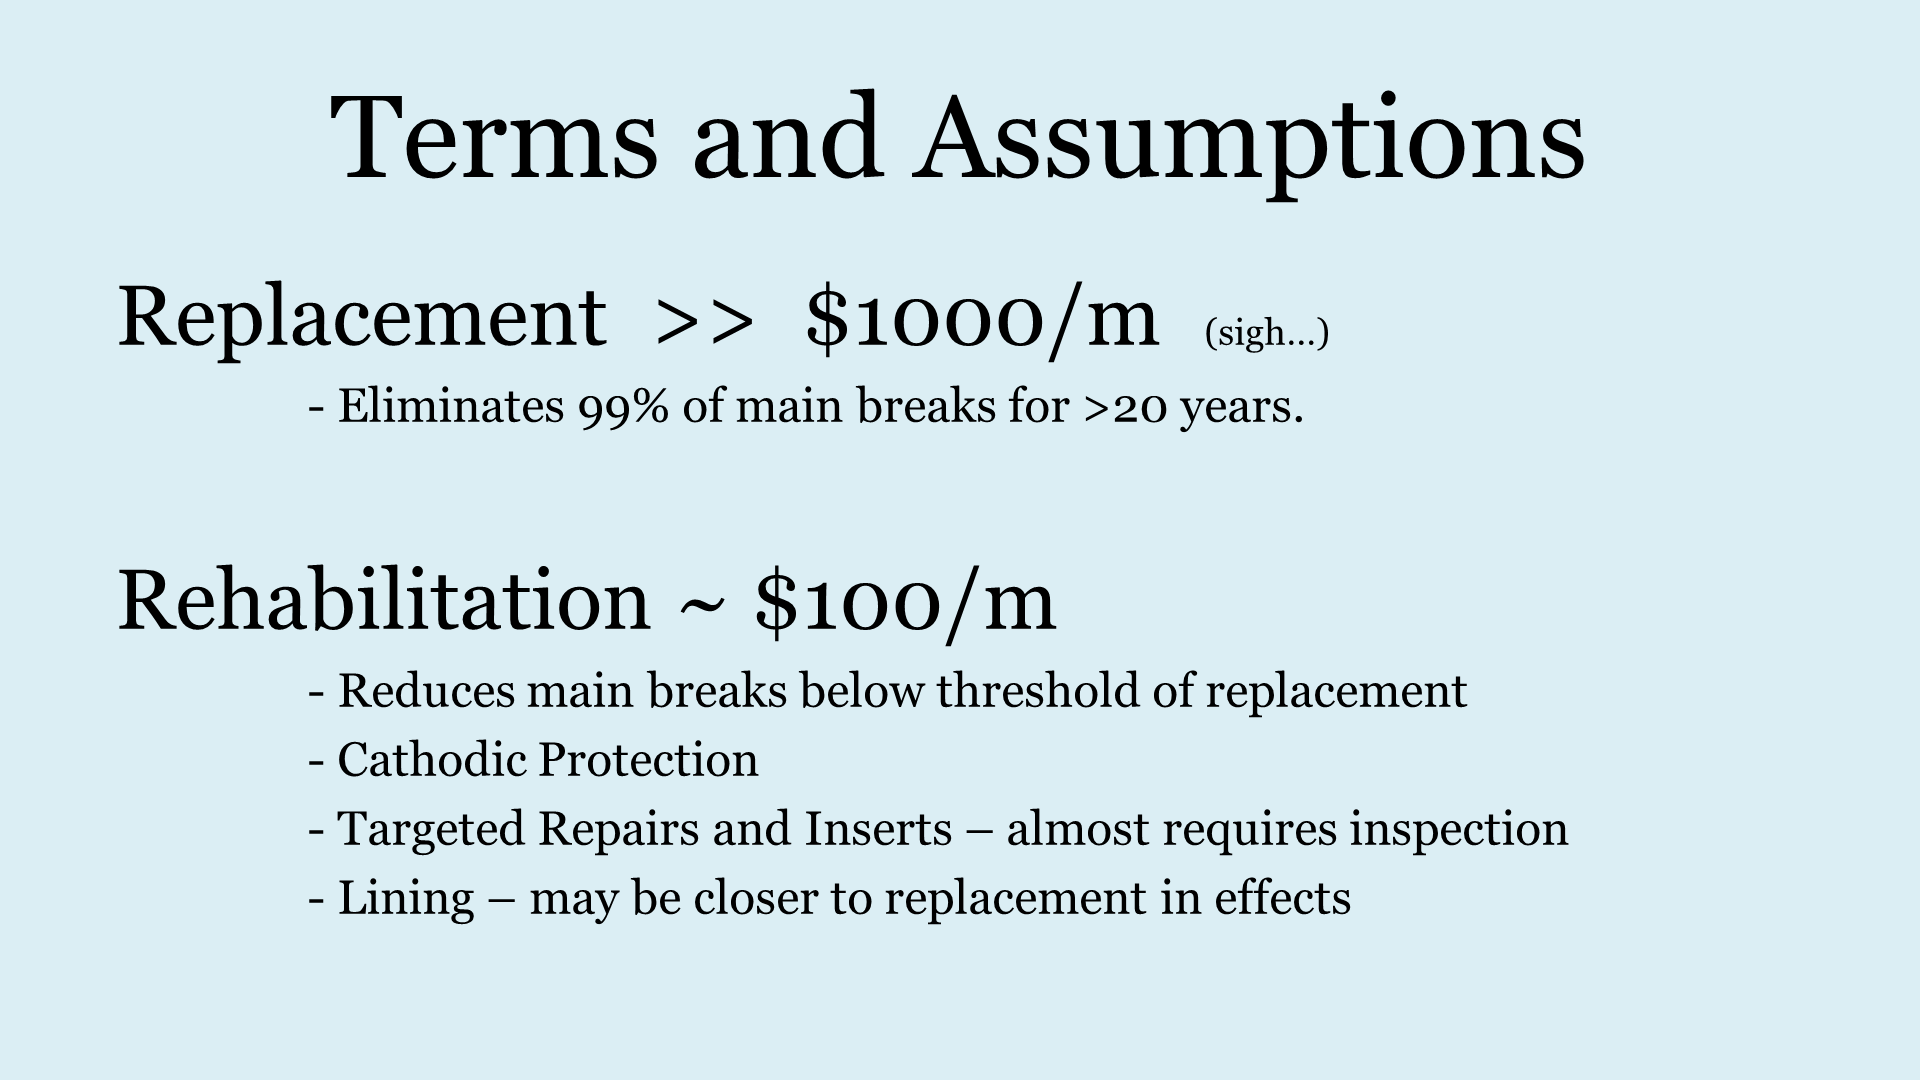 The entire topic may be mysterious to some: not a lot of cities are yet taking the in-between option of "rehabilitation".
Rehabiliation includes a number of options. Unlike Toronto, Calgary hasn't tried lining yet, and we found only limited cases for short replacements. But we had huge success with cathodic protection. We can hydrovac 15kg anodes into a main every ten metres for about $110 a metre on average, and main breaks then drop by 80% to 90% for the next twenty years or more.
fullscreen
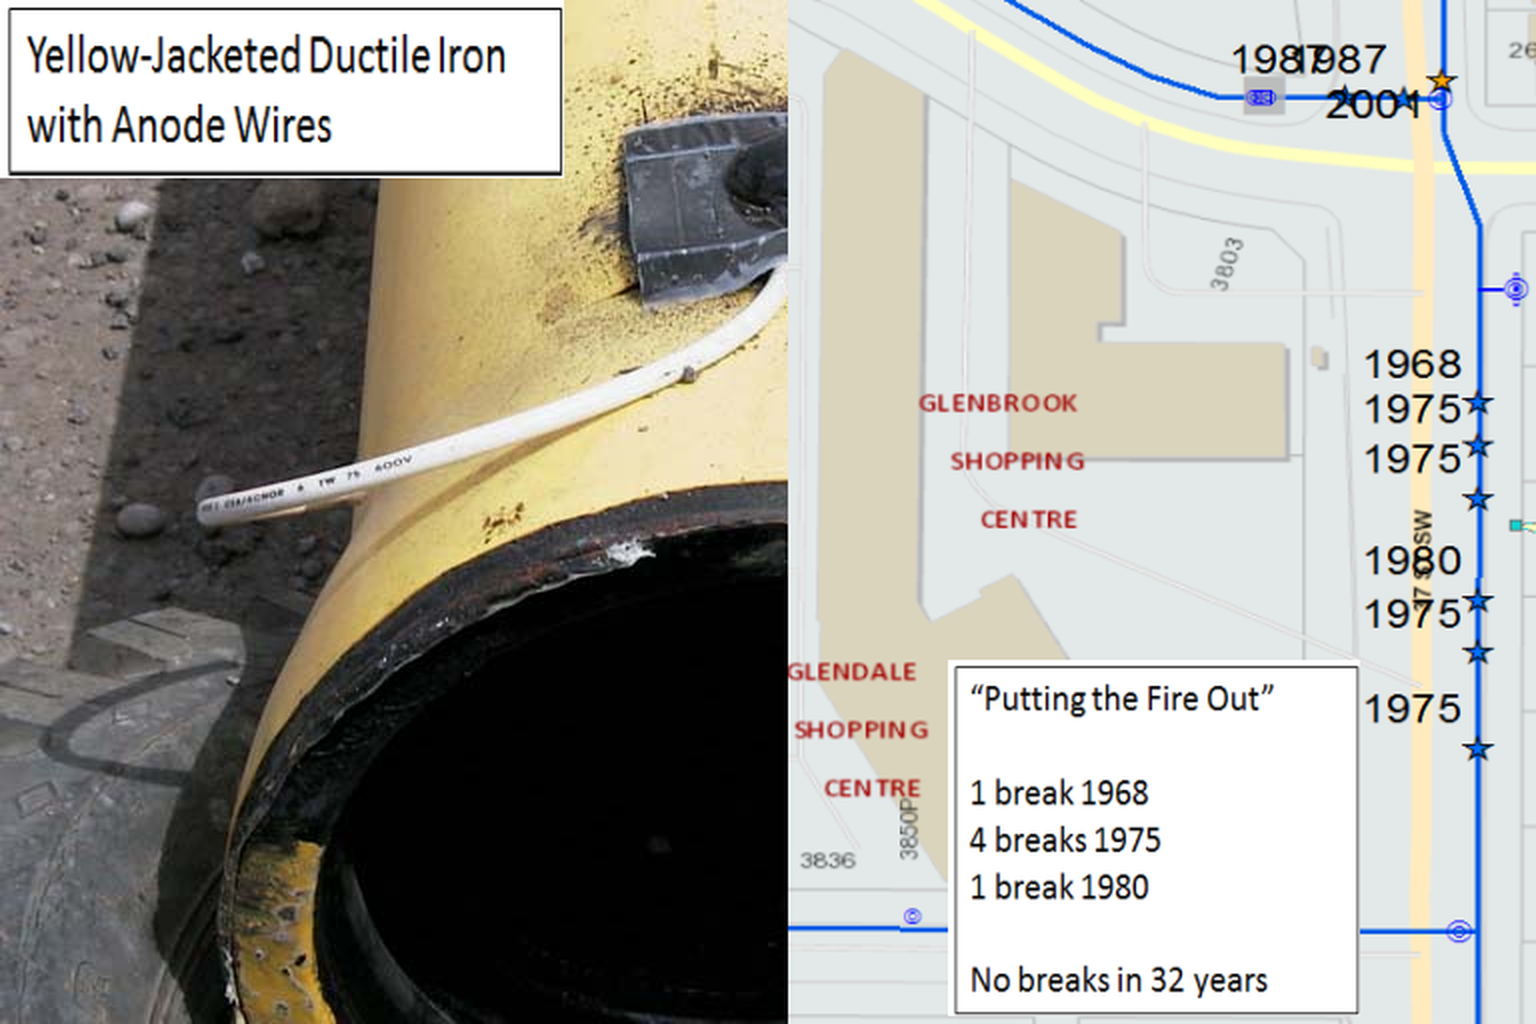 Cathodic protection is so ingrained at the City of Calgary I couldn't even find a written justification for our forty-year-old rule of installing an anode at every repair site. But on the right you can see what happens: anodes can "put the fire out", as the crews said, on a whole main. This main has actually gone 35 years now with no breaks, after five anodes installed in the late 70s. On the left, a picture of YDI, yellow-jacketed Ductile Iron, an oil industry product we adapted to water from 1973 to 1980 when we went PVC. More important than the heavy coating is that it's installed with anodes, you can see a bonding strap in the picture. YDI has one-tenth the break rate of bare DI, but the breaks shoot right up on it when the anodes wear out, until they're replaced. I'll be showing you a dramatic example.
My presentation will be in two parts: first, the cost/benefit oriented, probability-based "True Asset Management" approach I reached in 2012 after 20 years of data-collection and experiment. Then, the rule-of-thumb inference approach I had to use up to that point, except when I had the real story from an inspection.
fullscreen
 First, your fundamental starting point for asset management strategy and budgeting: the power law phenomenon. Power laws appear throughout nature, and it turns out bodies of infrastructure assets are included. It's why the Richter Scale is a log scale. The scale derives from Richter's work, as recently as 1956. Richter six earthquakes are ten times as bad as Richter five; but we get about one-tenth as many of them. Richter seven, one-tenth as many again, and so on. Since I now live in Vancouver where we are expecting the Very Big One, it's nice to think the Fairly Big One is ten times as likely.
It turns out nearly every natural disaster obeys power laws as well. Once they started looking, power laws were everywhere.
fullscreen
 A study of floods worldwide in 2005 confirmed how well the power law works to predict frequencies of different sizes of floods.
fullscreen
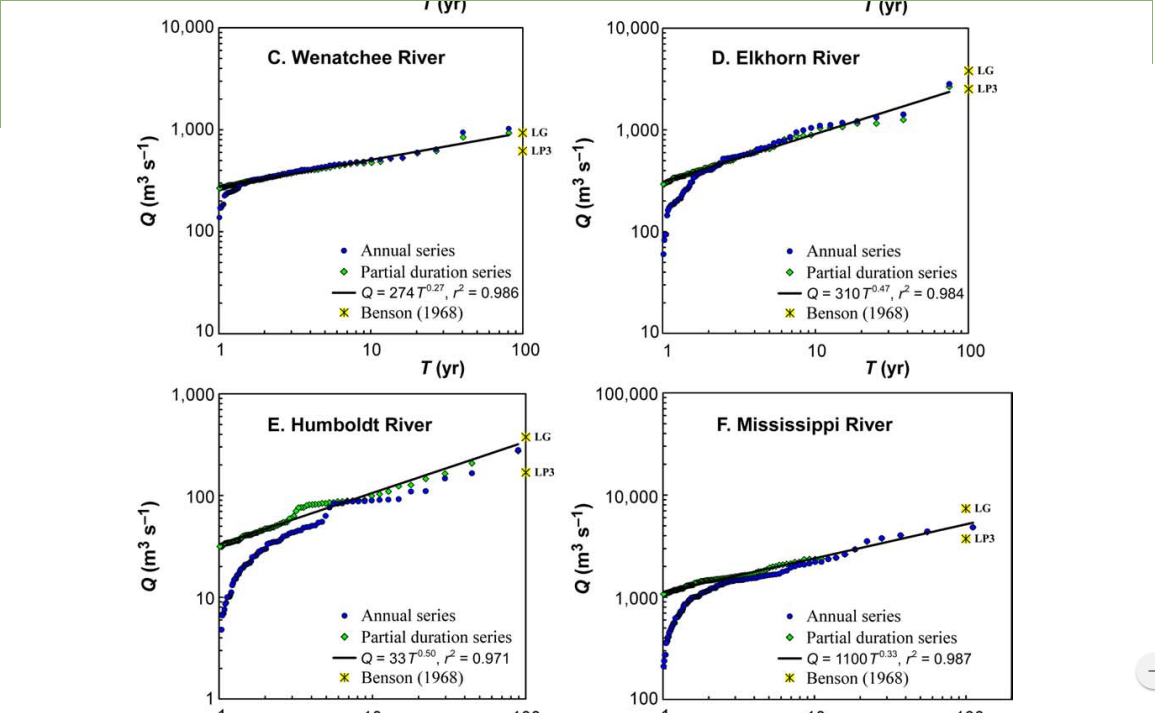 It doesn't matter what river you study, you get a power law; the exponent and coefficients change, but not the basic relationship.
The Richter and Flood power laws are log-log scales: it's floods twice as big in hectares flooded happen only half as often.
fullscreen
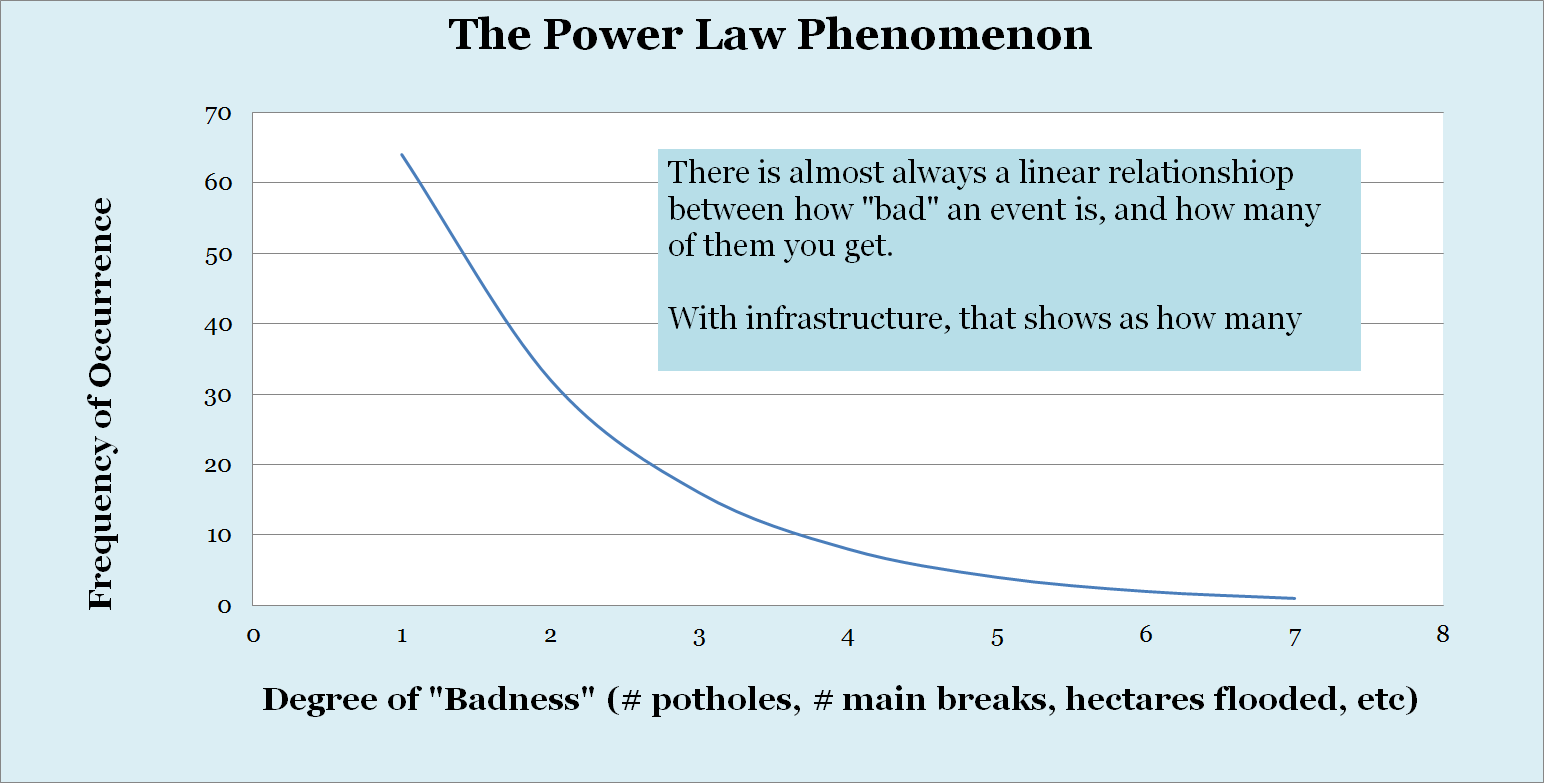 For infrastructure, I kept finding semi-log relationships in both water and sewer. That's also a power law, an even more dramatic one since every additional infrastructure problem comes exponentially less often. If the X-axis is the number of potholes in a road or main breaks on a water main, it's arithmetic, where the Y-axis with number of kilometres of road or pipe or wire is logarithmic.
I first spotted the exponential relationship between how bad a pipe was and how many of those I had to worry about, around 2001, and it was the most stunning insight I gained in my entire career. It was the how very closely the phenomenon obeyed the law, that dropped my jaw.
fullscreen
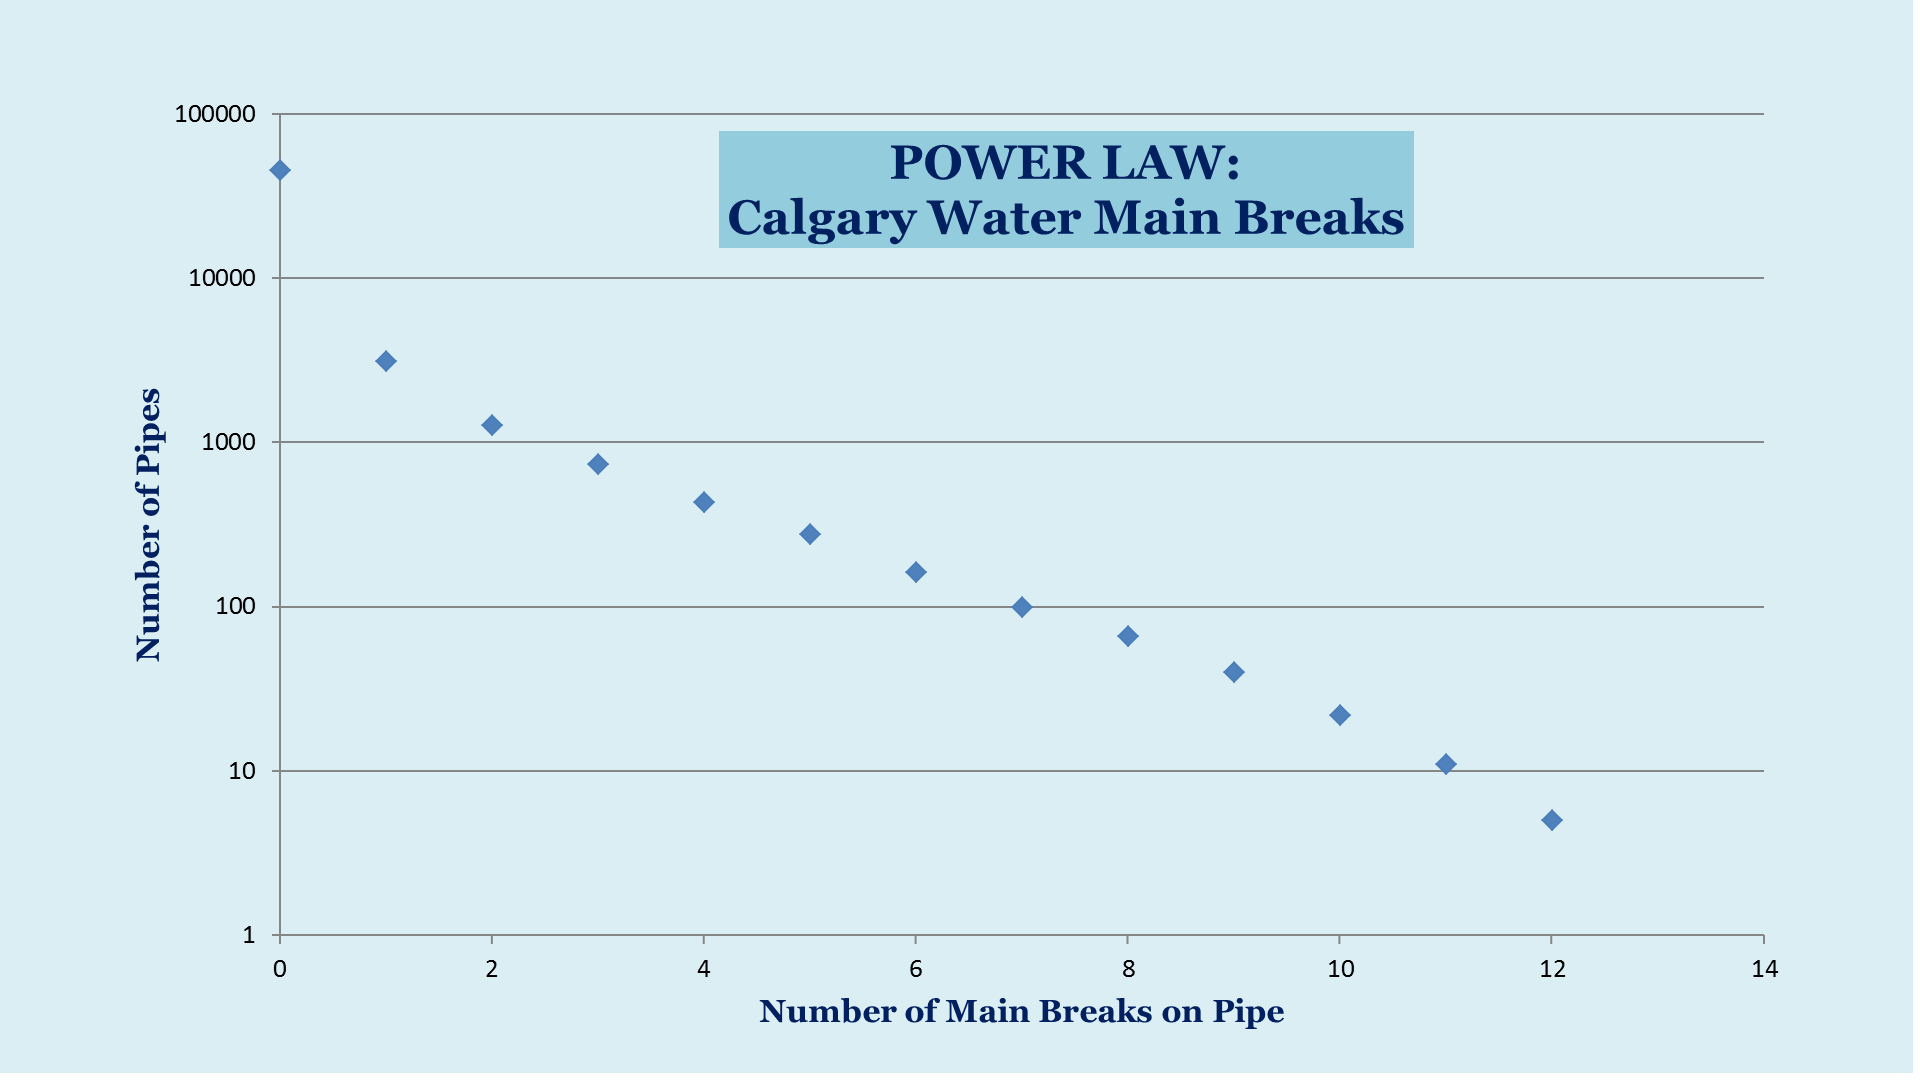 This is the graph that stunned me into silence in 2001. I had twice as many mains with ten breaks as eleven; twice as many again with nine, twice again with eight, all the way down. The only bend in the curve is the high number of mains with zero breaks - because half our system is plastic and that has basically zero breaks because of Calgary's ultra-conservative, careful install practices with PVC.
fullscreen
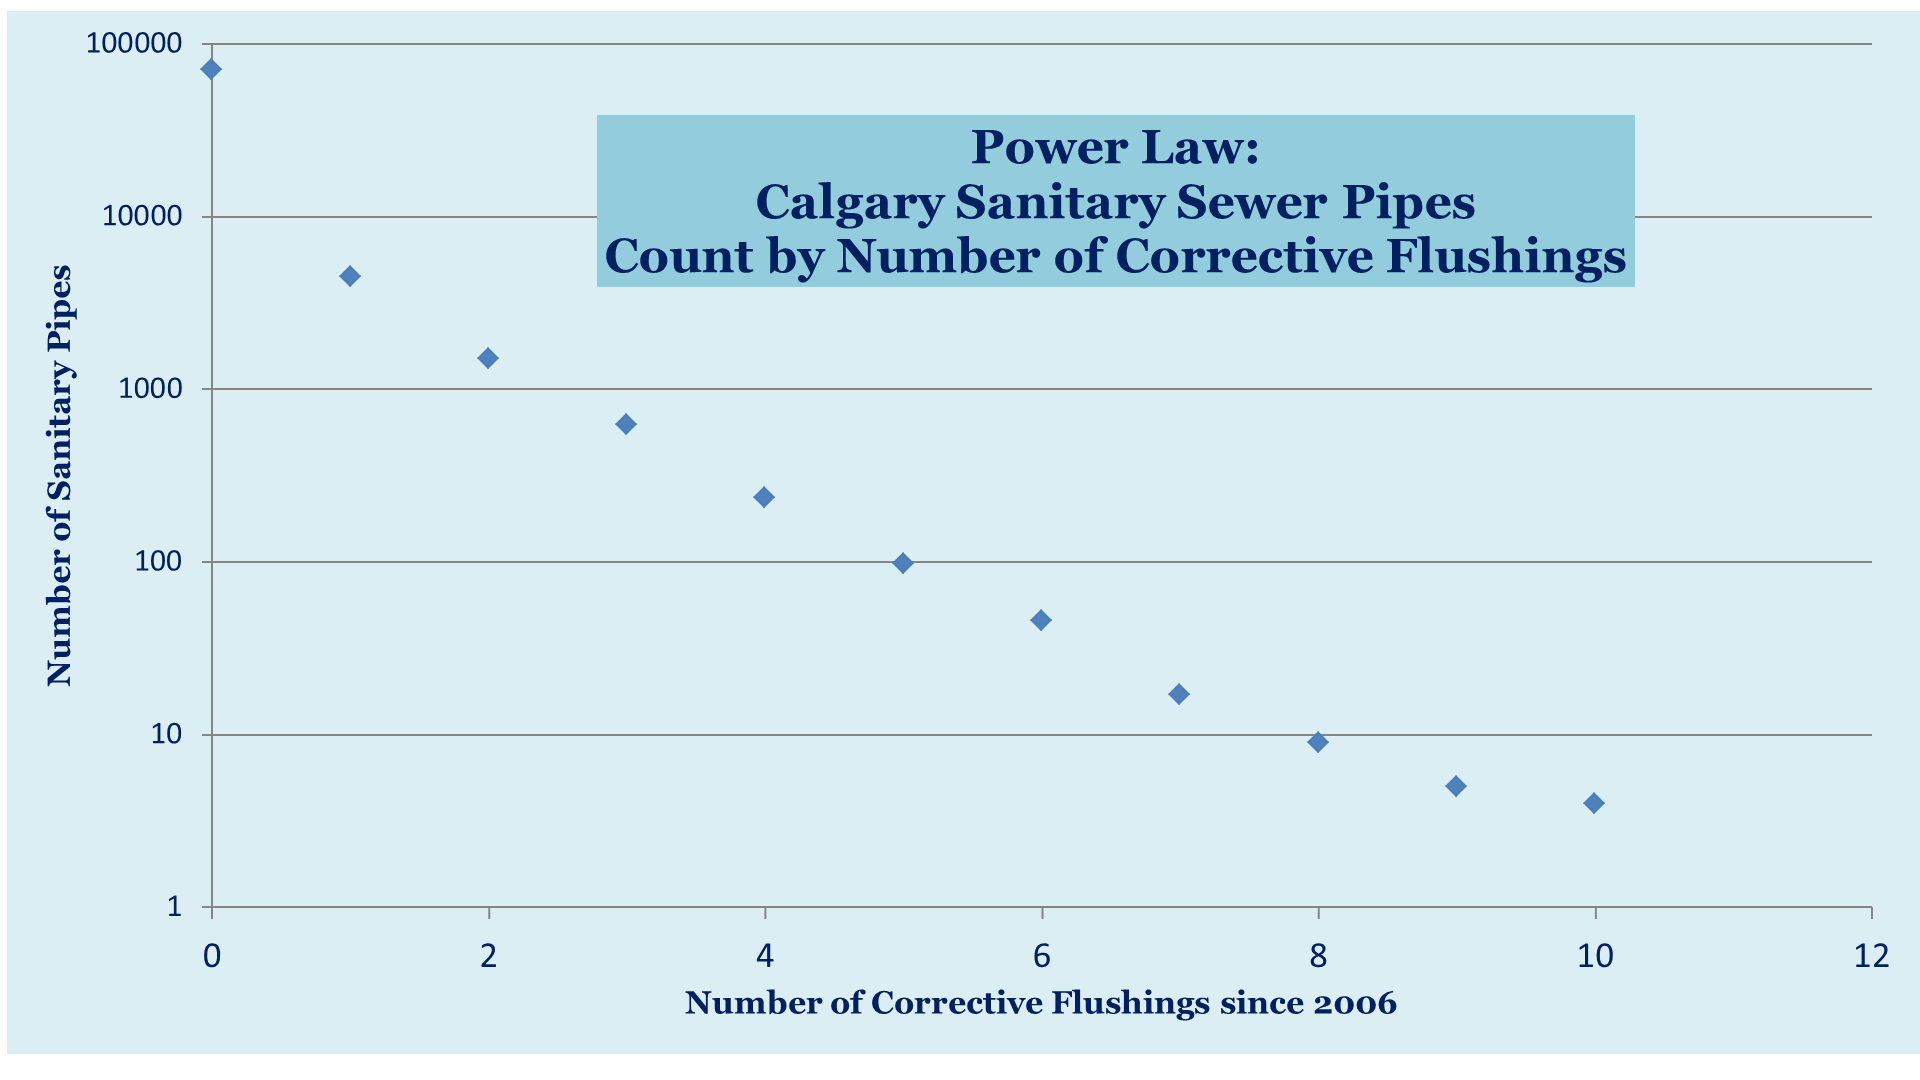 At first, I assumed I'd found some amazing new law about the corrosion of iron. Something about steady corrosion rates but frequency of appearance of pits had some distribution that showed up as a power law for actual holes.
Then Calgary Waterworks merged with Sewer, giving me Sanitary and Storm systems in my database. Soon after, I was graphing the rough equivalent to main breaks for sewer: the number of times they needed a corrective flushing. Understand this isn't about corrosion and holes, just how often gravel and plastic bags and other debris plug one up. It's related more to usage, house density, and slope of the main. None of that mattered except to pick the exponential constant and the coefficient: it was another power law.
fullscreen
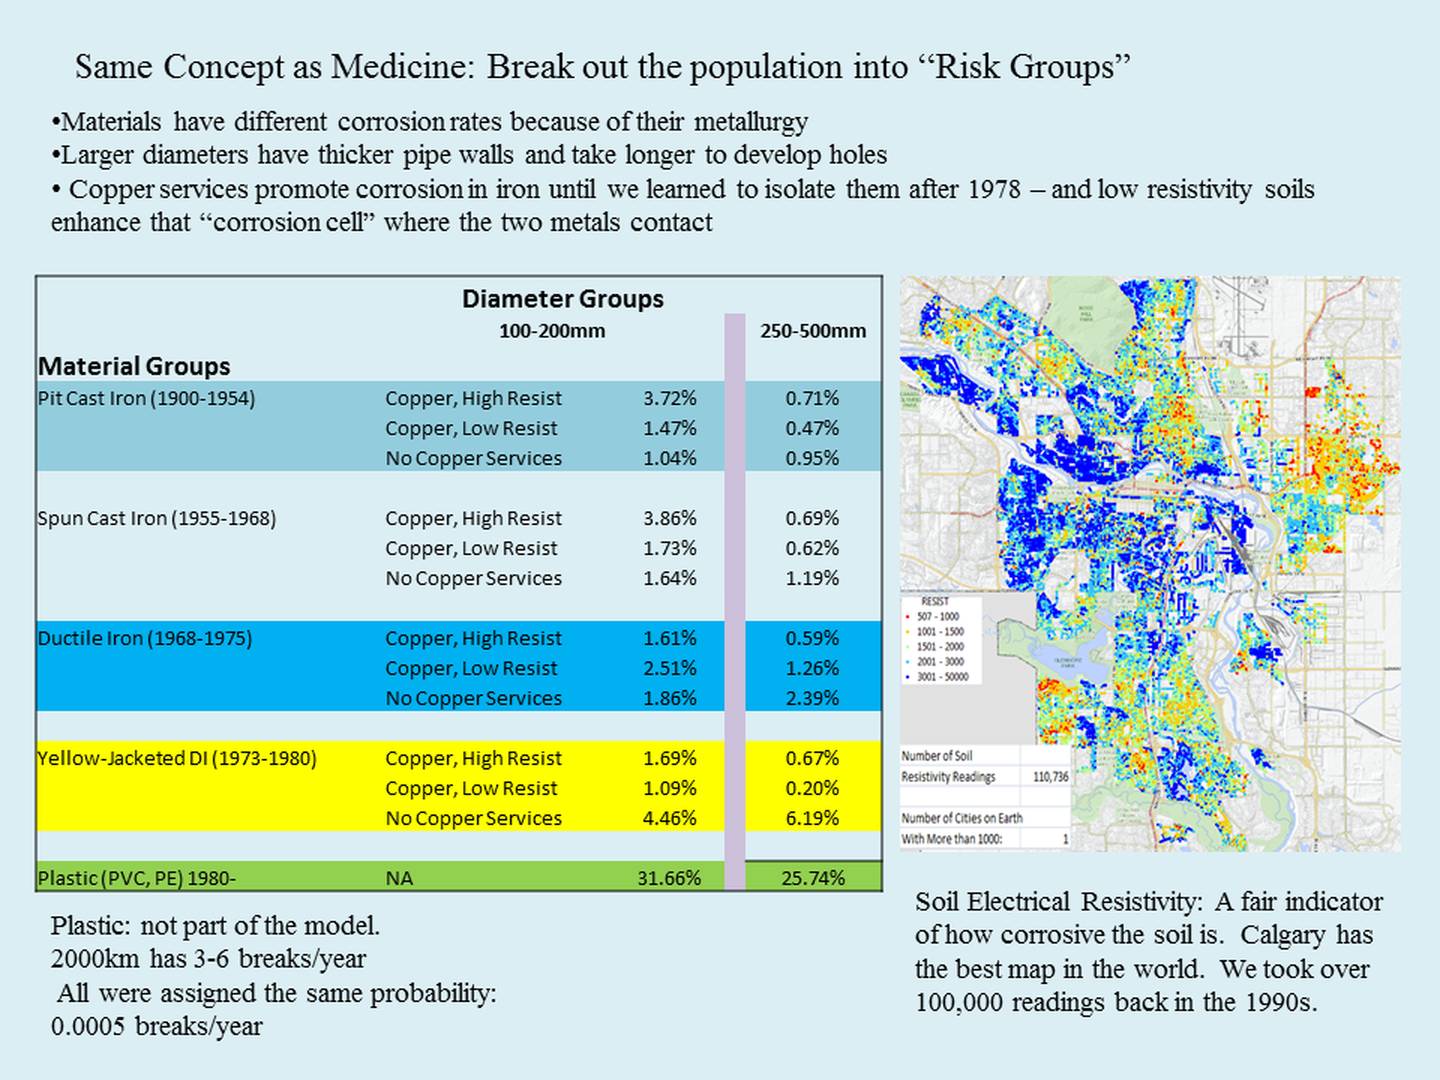 While the mains had some grand-average break probability shown in the power law graph, the very different materials - Thick-Walled Pit-Cast Iron, Thinner Spun-Cast, then Ductile Iron, thinner still - all had different break probabilities; within those, different diameters, and different "corrosion groups" as I called them: with and without copper services. And for Calgary, where there were copper services promoting iron corrosion, I could distinguish higher and lower probabilities within those again, using a soil corrosiveness index. The map on the right shows 100,000 soil tests we did in the 90s that indicate "hot" vs "cold" areas of soil corrosivity.
fullscreen
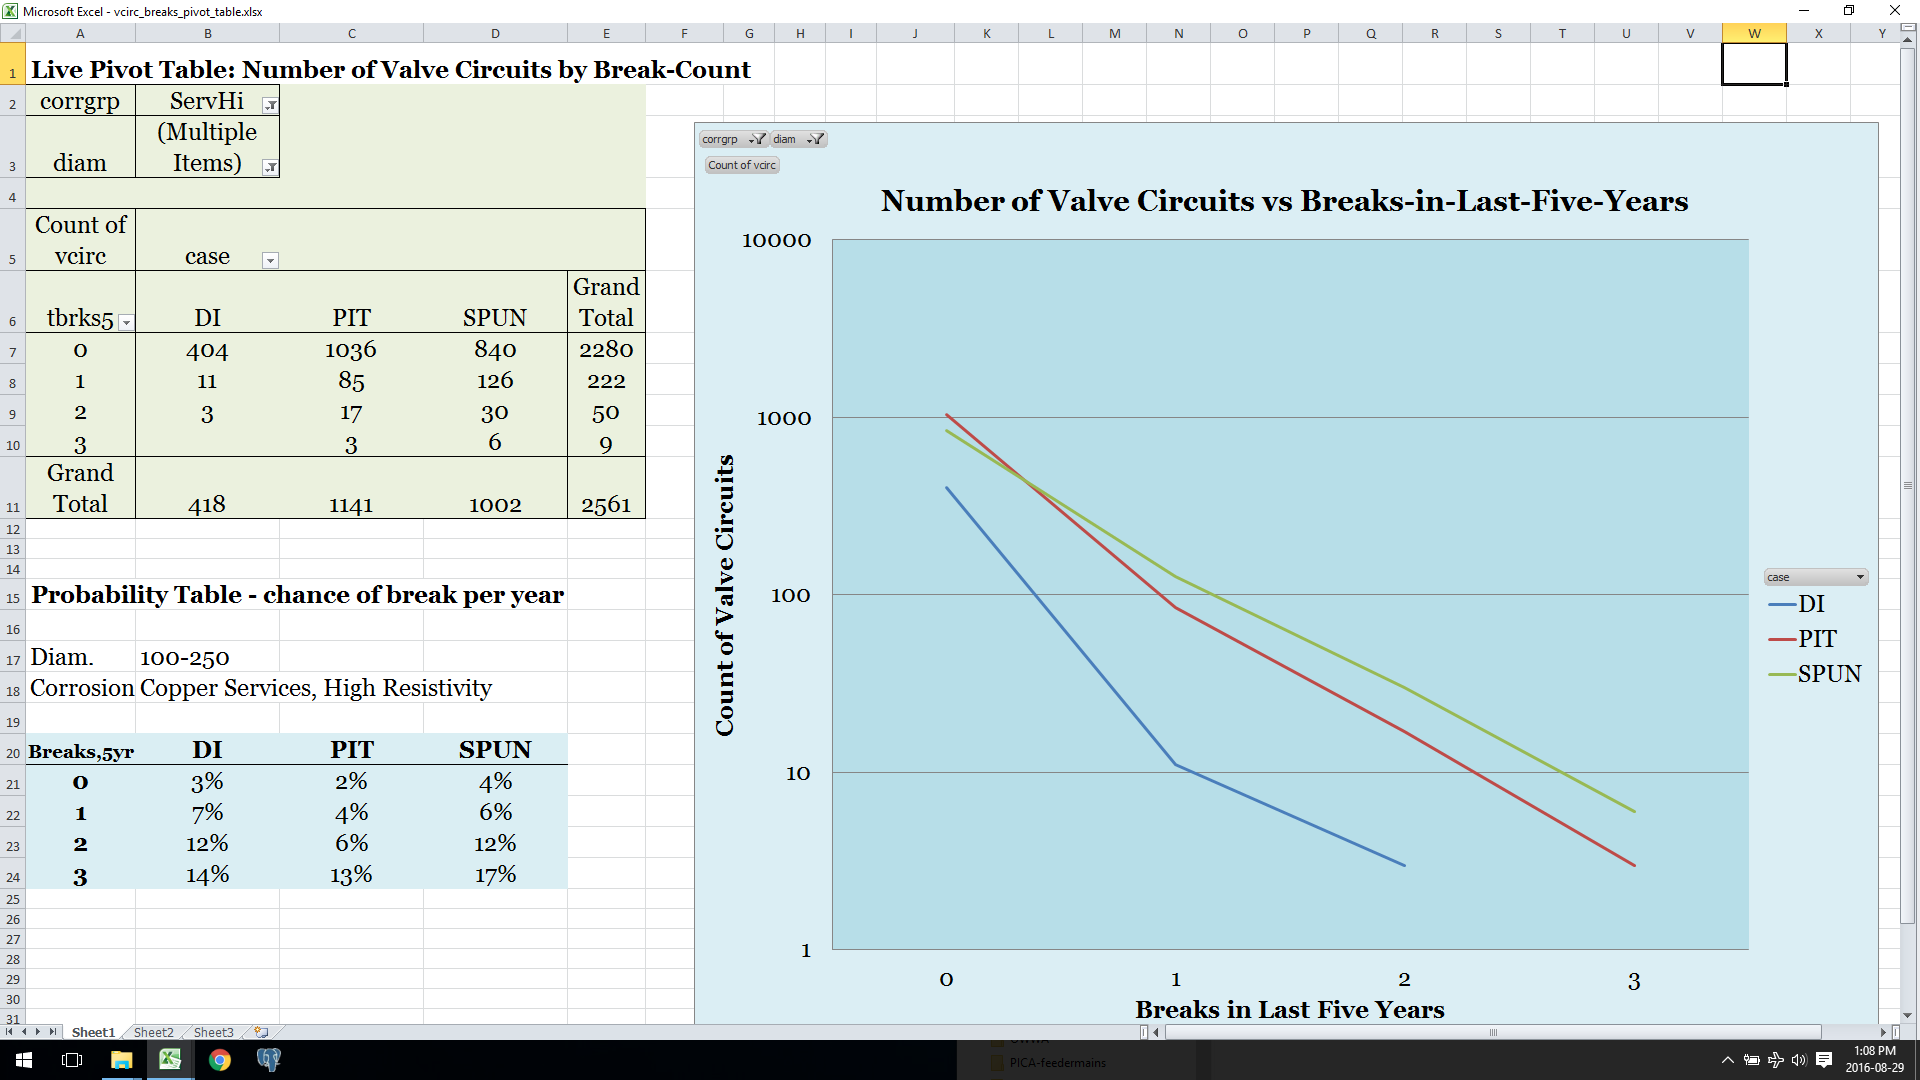 When you do the same graph again, counting blocks of main vs the number of breaks they've had - this time just breaks in the last five years, so the axis is just zero, one, two, or three - you still get power laws. There's a slightly different slope for each of DI, thin and thick-wall CI; different slopes again for different diameters and corrosion risk groups.
At the lower left, example probabilities for the case shown in the pivot table and pivot chart: for the group with 100mm-250mm diameter, with copper services but in high resistivity soils, meaning lower corrosion rate, for each of three material types. The power law is expressed in how the probability of a break next year goes up exponentially with number of past breaks, from 3% to 7% to 12%, nearly doubling each time - at three breaks, it levels off for DI but not CI, probably because DI responds better to our anodes; every city would have different probability tables depending on procedures like that, and of course their soil, and moisture.
So that table, four probabilities for each of 24-some groups, breaks the city into over ninety statistical bins and gives me a probable number of breaks next year on each valve circuit. Multiply by the TBL cost of a break, and you have risk in dollars on each valve circuit.
fullscreen
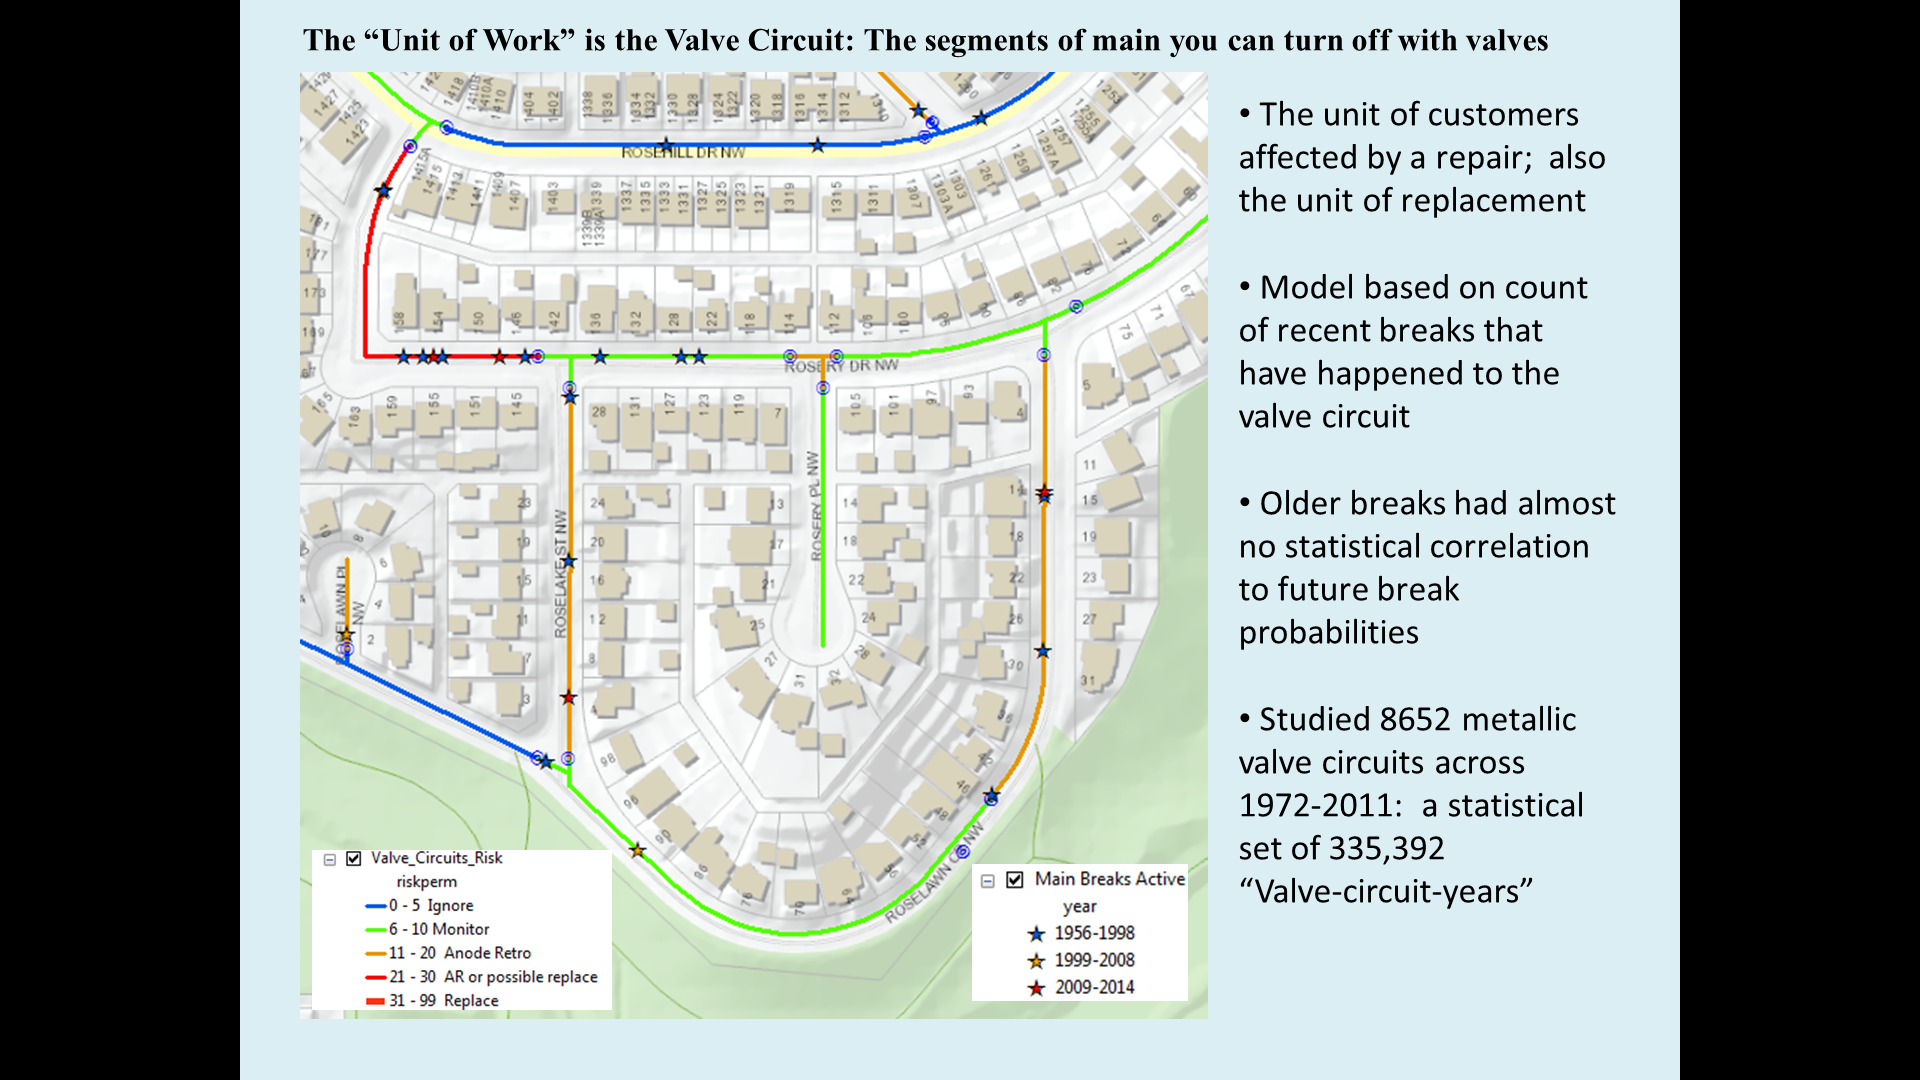 Valve Circuits, for those who don't work in distribution, are the natural unit of work for water mains: they're the chunk of system turned off for repair when you walk a circuit around a break turning off every valve. It's also the natural unit of replacement, valve-to-valve. So, it works for both that, and the TBL cost of a break, counting a cost for every house out of water; I used $250 each, plus $25,000 for the repair cost. Multiply, say, $27,500 if there are ten houses by a 10% chance of a break, and the risk on that valve circuit next year is $2750. If it were 275 metres long, that's $10 per metre.
This maps several valve circuits by their dollars-per-metre risk value, with the red valve circuit being closest to being worth replacing, but the orange ones only worth the cost of anode retrofit. THe units at left are "RiskPerM", the risk in dollars per metre per year.
fullscreen
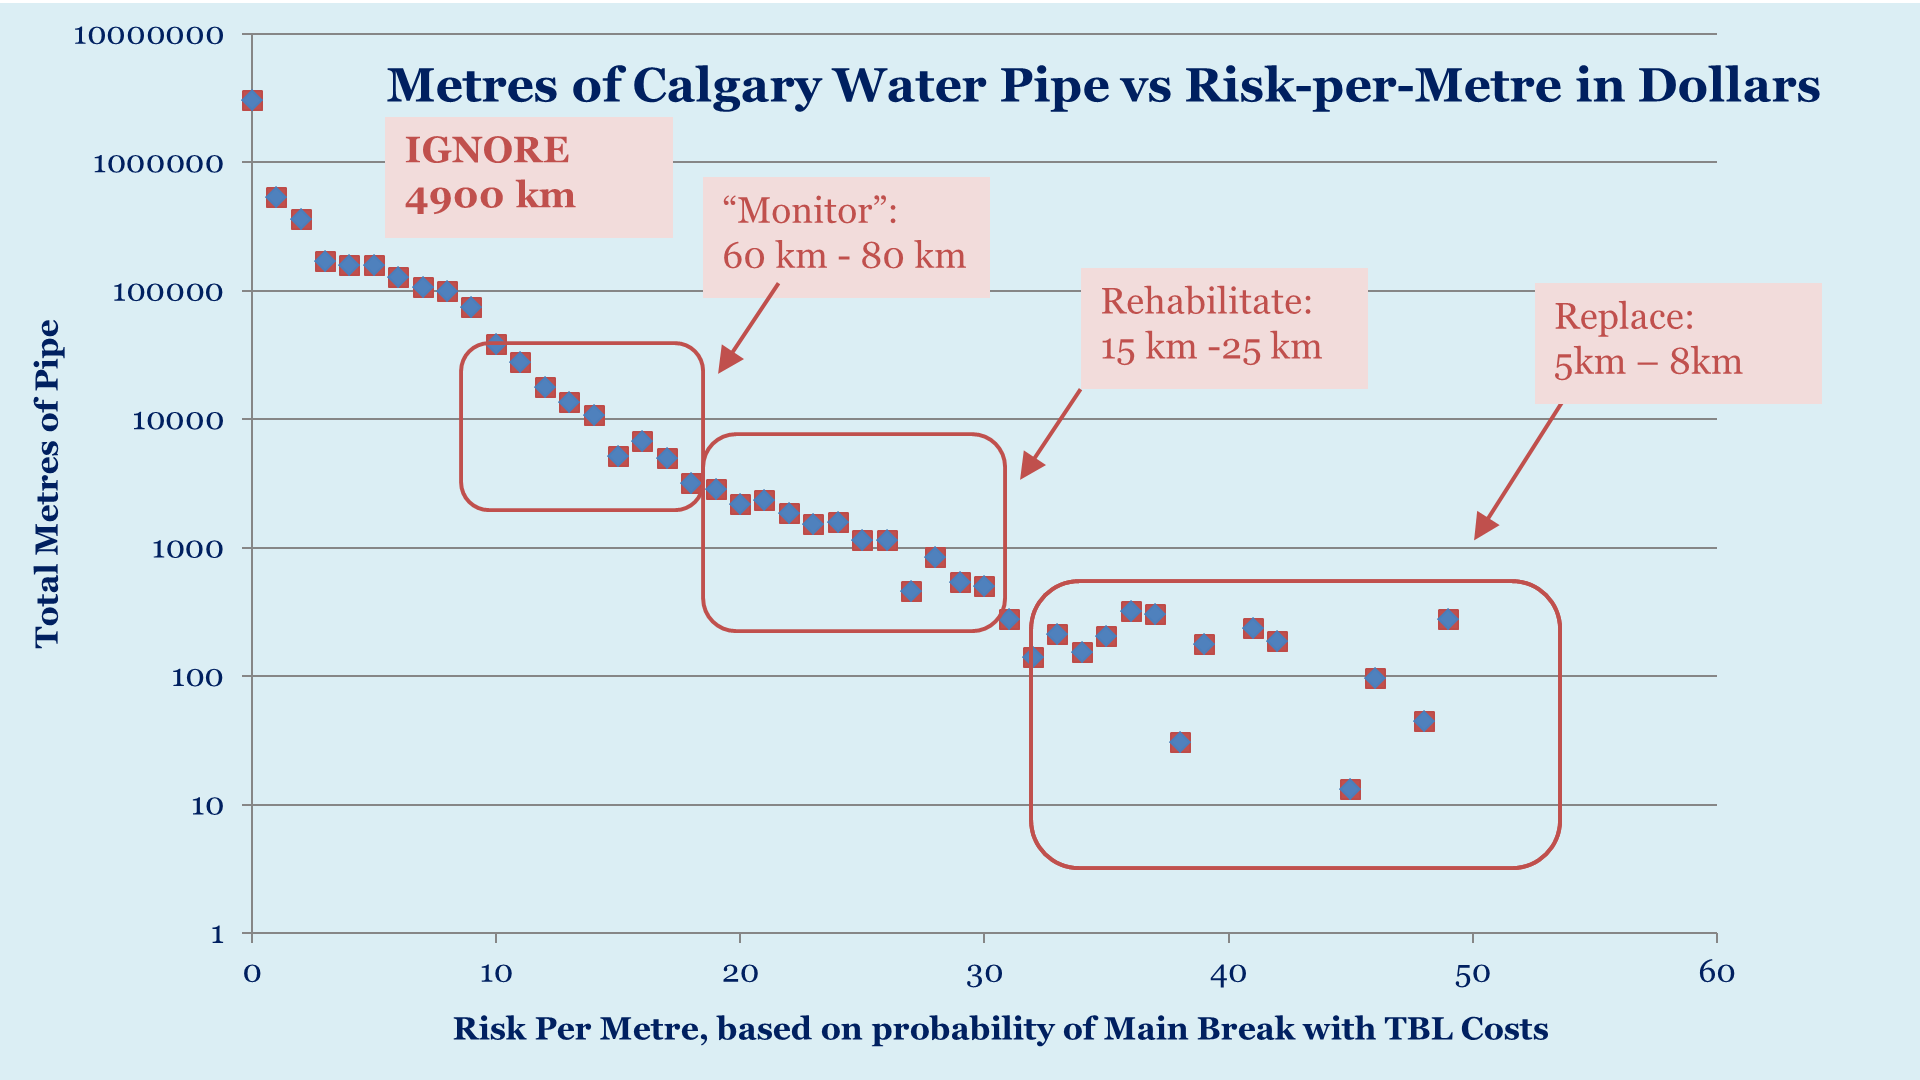 Summing up 30,000 valve circuits, this graph now budgets and chooses the Calgary Water Capital Replacement Programs.
Notice that the power law breaks down at high numbers here, the graph is uneven. To me, that says my model is what's wrong - if it were correctly modelling the natural phenomenon, it would be smoother on a log scale. But it's kind of irrelevant, because the job of this graph is to tell me which 98% of my valve circuits to IGNORE. I have "monitor" in quotes up there because it's a joke - whenever the United States was going to do nothing at all about civil rights in Saudi or demonstrations in Egypt, Mrs. Clinton would say "We are monitoring the situation"...which is what I'd tell people with one main break who wanted that to trigger immediate replacement. Except for being a main I'd pick for a PICA SeeSnake inspection if there were worse mains around it, "monitor" actually means "do nothing".
Above $10 per metre per year, I could borrow enough money per metre for our form of rehab, which was anodes every ten metres. Most of it was on the DI system, which has straps between mains letting current go further. Keep in mind that risk in dollars per year is the interest you can afford to pay on a capital treatment: so $20/metre would let you borrow $450 per metre for Aquapipe's lining solutions.
fullscreen
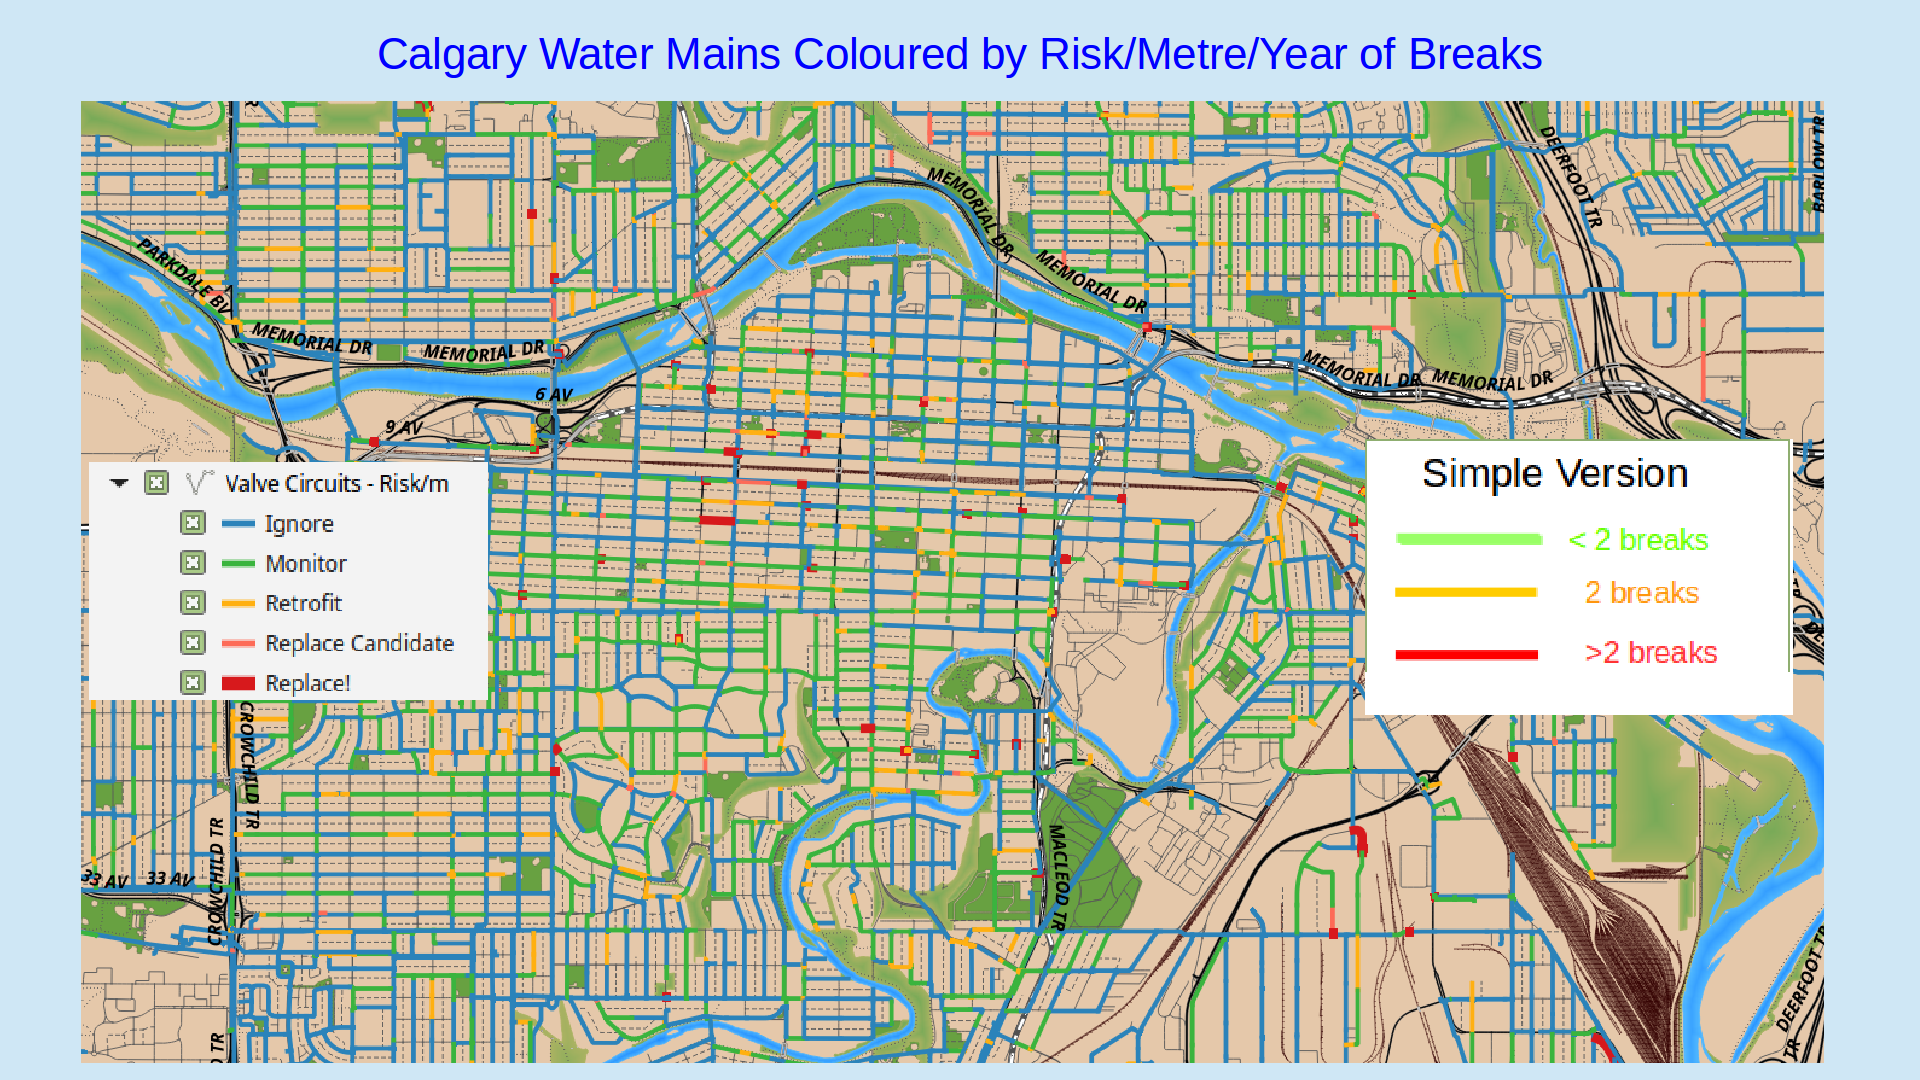 We shop for mains to replace and retrofit each year with the full-city risk map, colouring the valve circuits by their risk number: you could see the potential replacement program in red and rehabilitation program in orange - or at least the best candidates to examine.
In red, barely a tenth of a percent of the system. In orange, nearly a whole percent..between them, just a few hundred mains each year that get any attention from a human being.
As the "simple version" of the legend indicates, it's usually the case that all my statistics boil down to "think about retrofit at 2 breaks, seriously consider replacement at three". You can start by just doing that after only five years of careful break-counting and mapping.
Then you can move forward to a reasonably-accurate probability-based system like this as soon as another five or ten years of record-keeping gives you enough cases to to build your own probability table. It will give you the statistics you need to justify the size of your program, too, tell your managers whether you have enough money. Until you get there, the rest of my discussion is about how to spend the money they give you on the most-likely mains by rules-of-thumb.
fullscreen
 Like most people, I worked out a system by trial and error when confronted with a complex problem, and then had the centipede's dilemma of figuring out my own thought processes when I had to teach it to young engineers taking over my job.
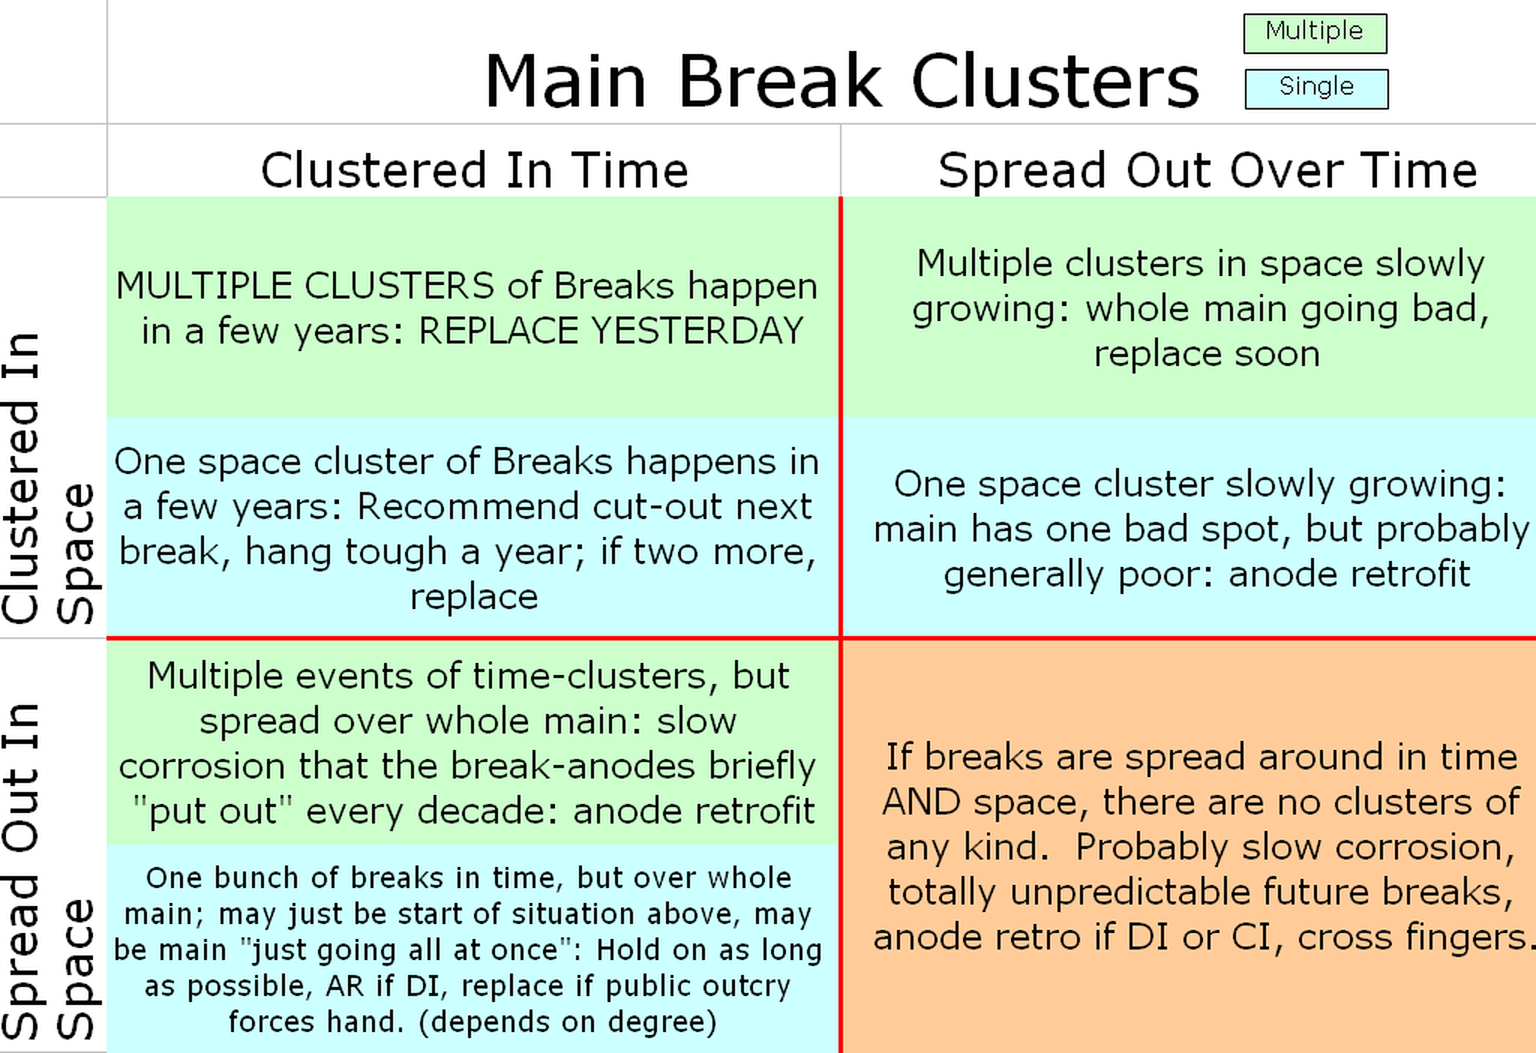
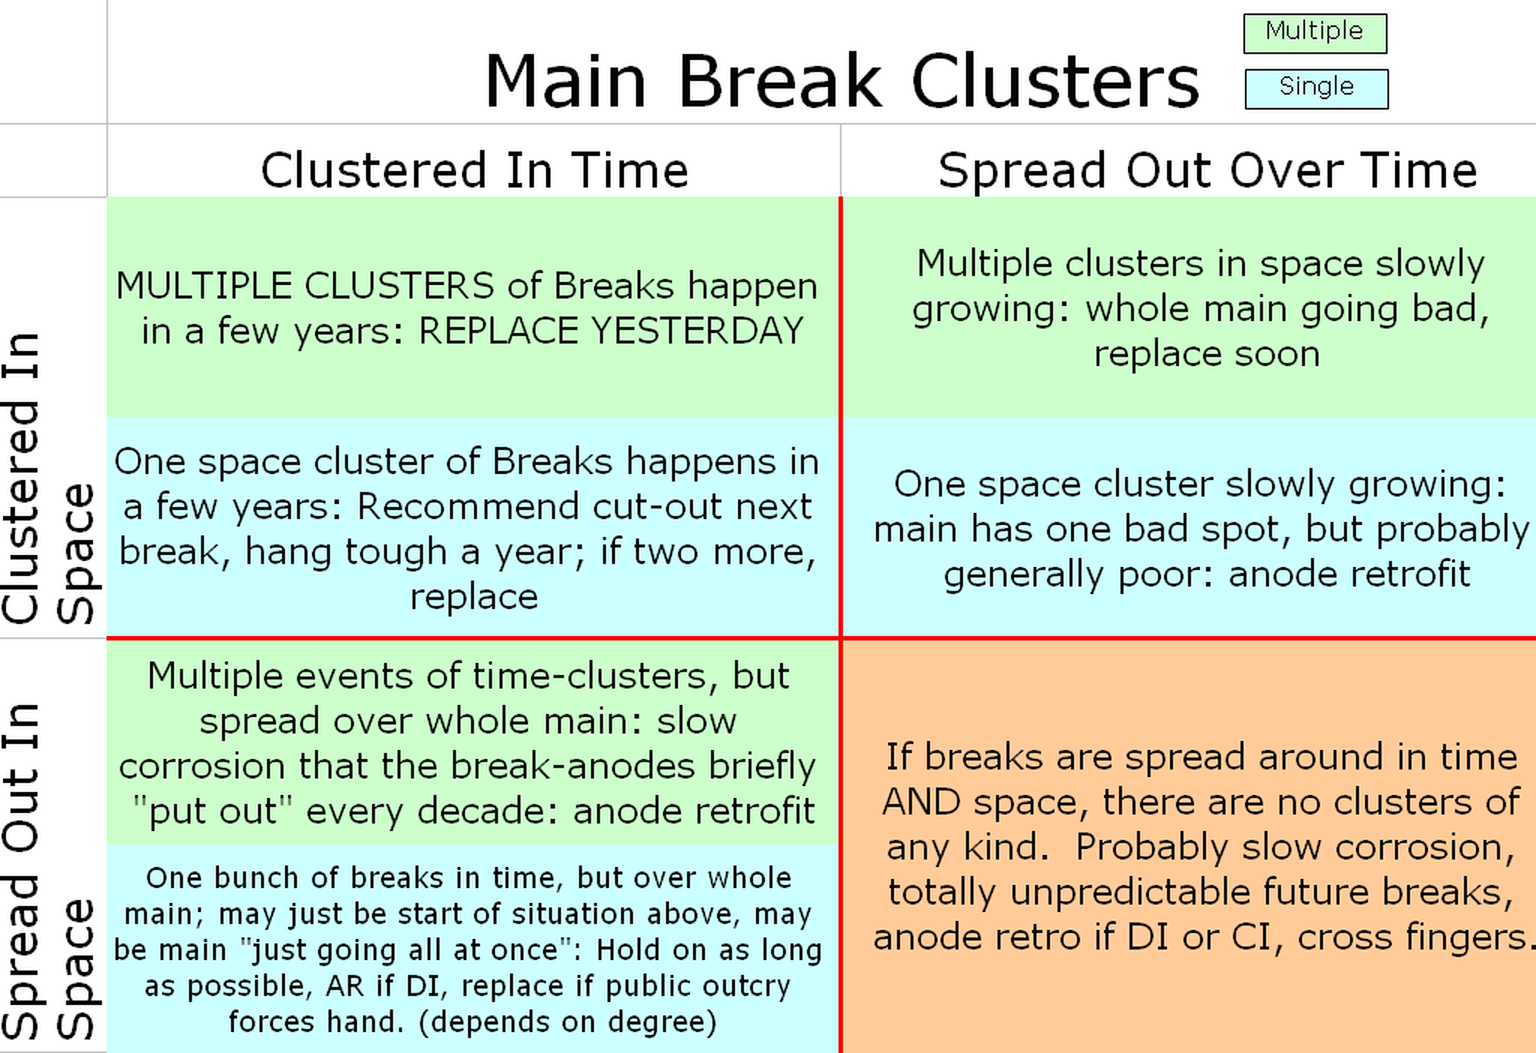
I got it down to a single slide that covers seven kinds of cases. It's whether main breaks are clustered or spread out, whether the clusters are in time or space or both, and whether there's just one cluster or multiple clusters. In Calgary, where the glaciers churned up the soils so that you can have corrosive soil on one block and just sand or gravel all around it, the concern is to not replace main that's fine because it happens to be next door - literally - to main that's in black dirt, and thus being eaten alive by high sulphates.
We'll go back and forth from this slide to cases from my map system. First up, if you have breaks clustered in BOTH time and space - if you have bunch of breaks suddenly happen in one spot. At top, if there's more than one space cluster going at once, the main is done for. If there's just one end of the main popping yearly, you may be able to save the rest by cutting out just around the breaks and adding anodes elsewhere.
fullscreen
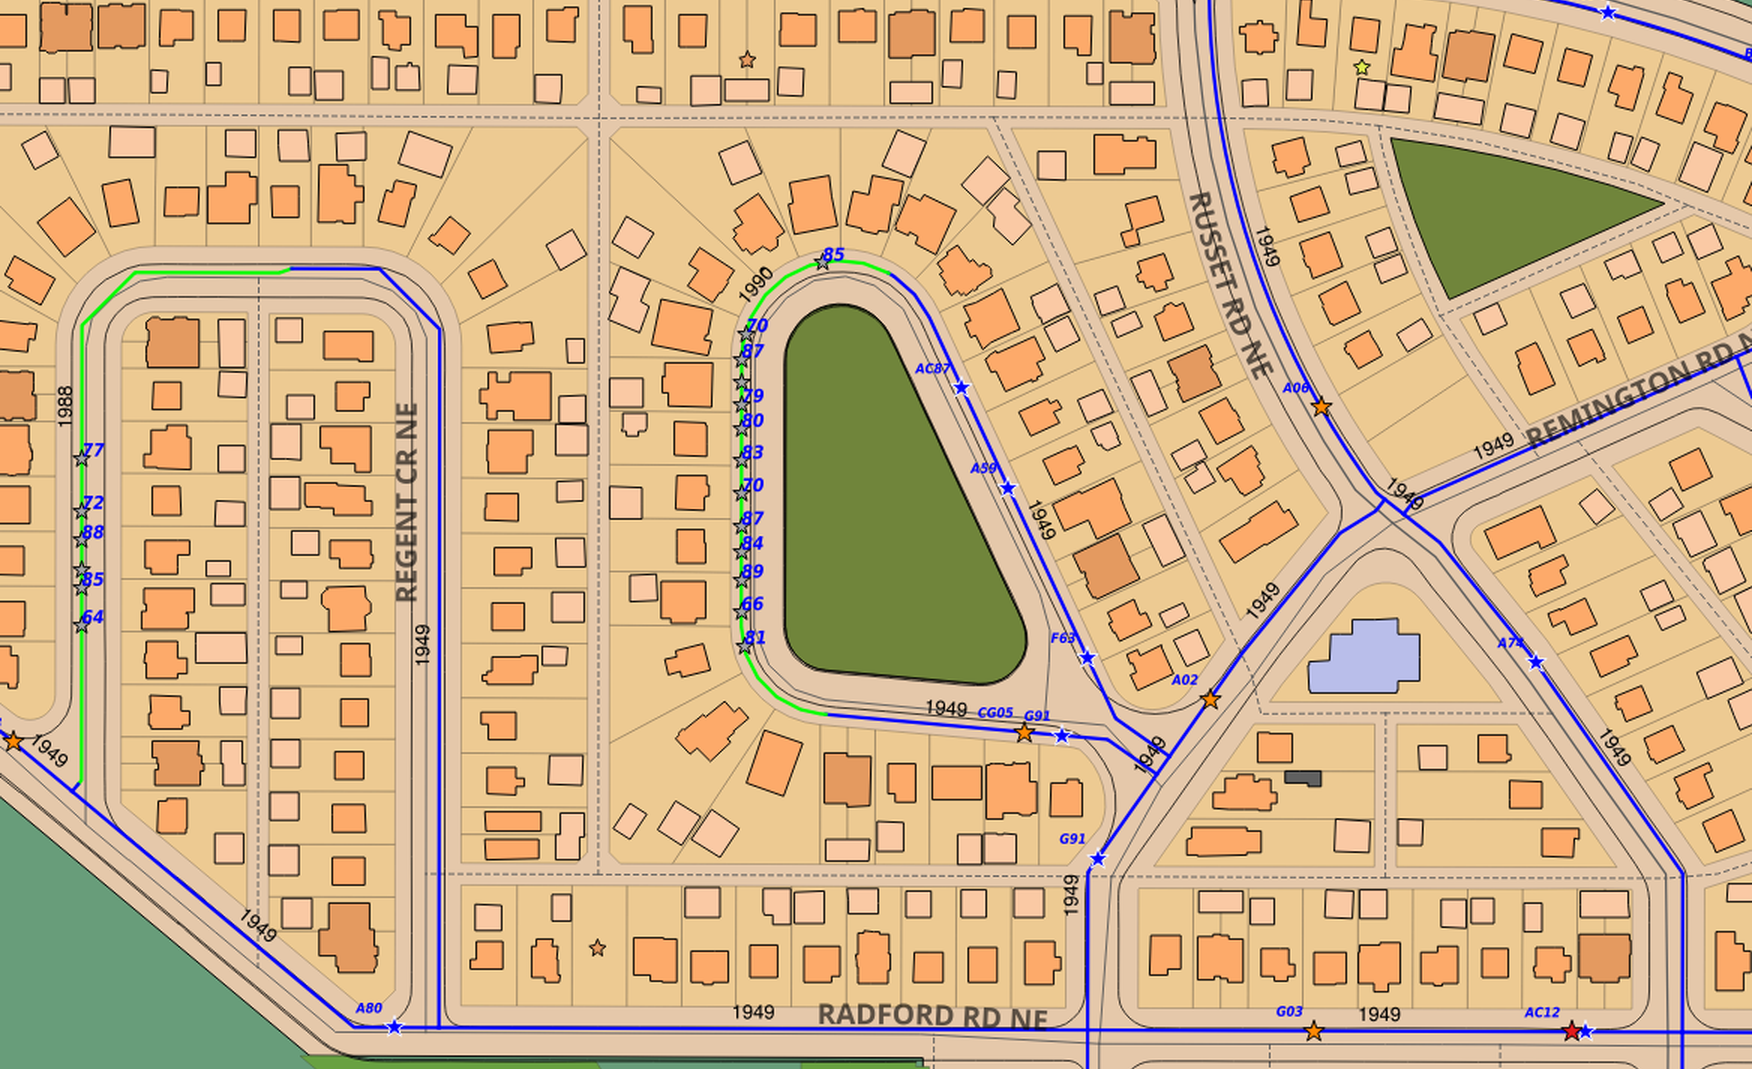 I found a neighbourhood in northeast Calgary with both examples. The blue lines are the cast iron mains from the late forties; the green lines are PVC mains that were installed as replacements about 1990. The grey stars show the now-obsoleted breaks on the mains they replaced, with the year beside them. The coloured stars are the very few still-live breaks on surrounding mains that are still nowhere near to needing replacement 25 years later.
fullscreen
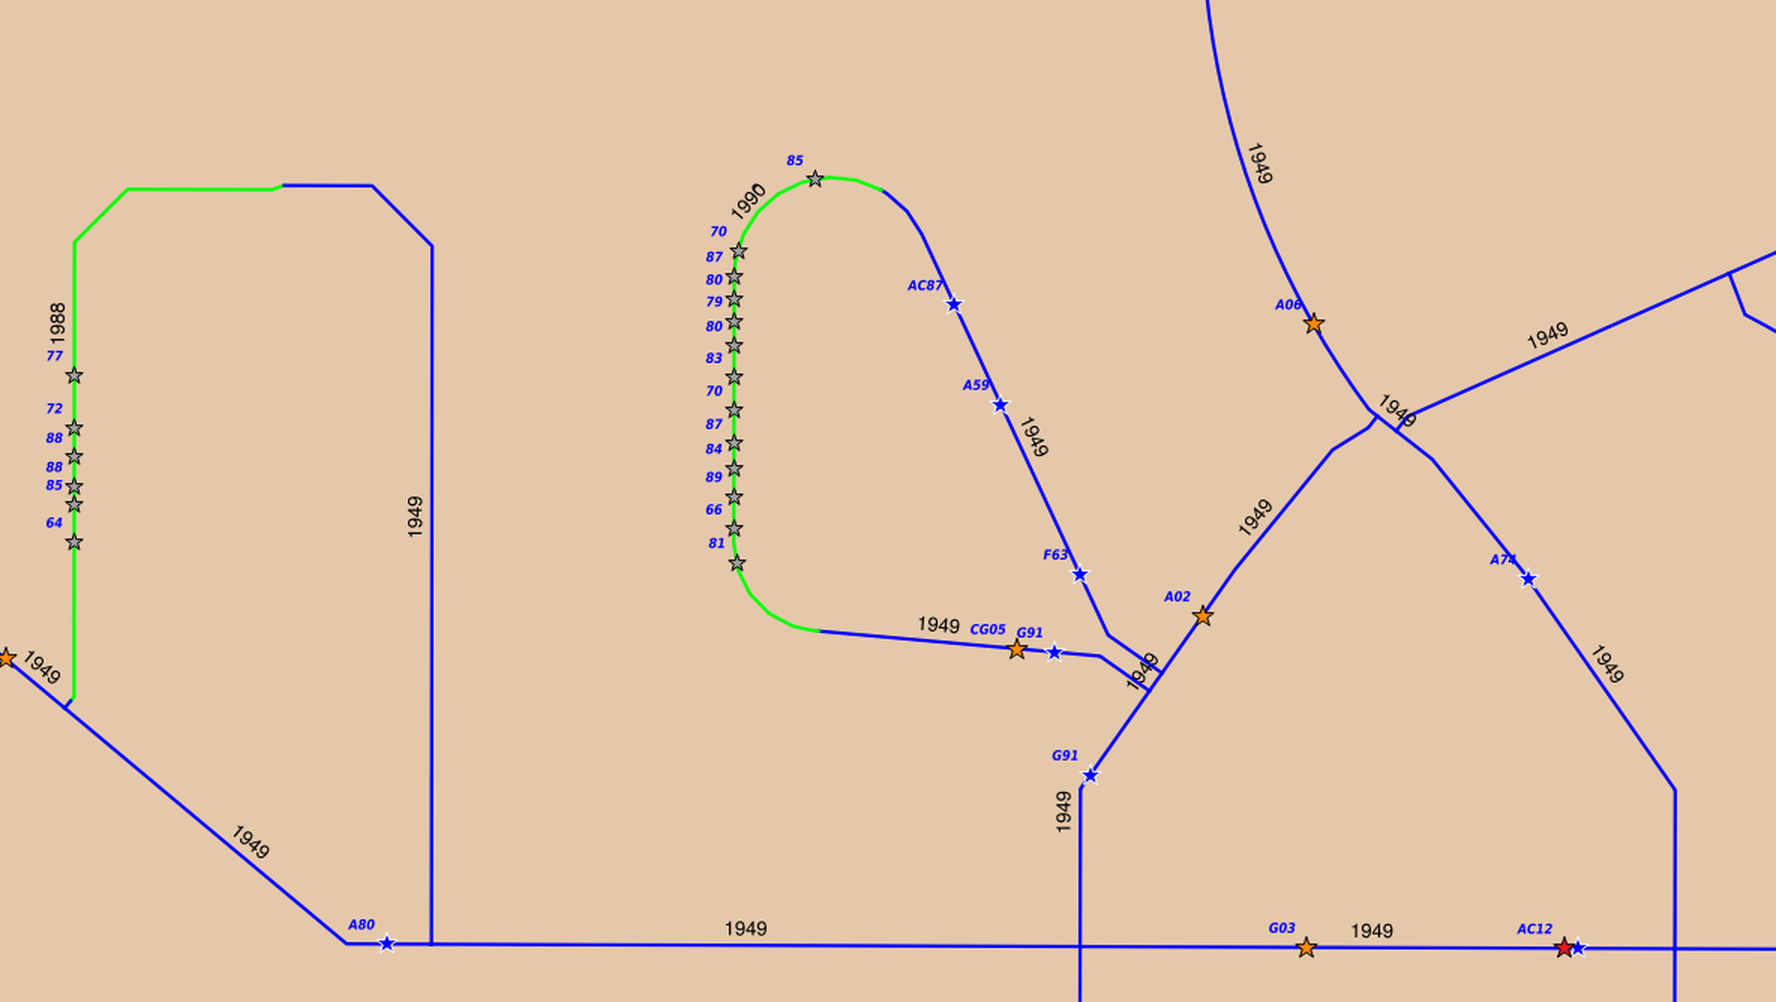 Removing the visual distraction of the streets and houses, at left we have a single cluster that just kept getting worse - 64, 72, 77, 85, 88 - the breaks kept coming closer together. If this had been at one end of the main, we might have replaced just the cluster and cut-in a valve to separate that from the rest. But it was just in the middle of the valve-circuit, so we couldn't save much; we just replaced a whole block.
And that wasn't even a question, at right. Not so much multiple clusters as just everywhere. More breaks happened that we'd allow today as back then we were getting a thousand breaks a year (last year was 220) and we just couldn't get to it soon enough. I know it doesn't take a conference paper to tell you to replace this main, I'm just defining one end of the spectrum.
If I can draw your attention to the main at the bottom of this slide, the one with no main breaks at all since install in 1949, I can show you how it soon will become a single-cluster case - one we can save.
fullscreen
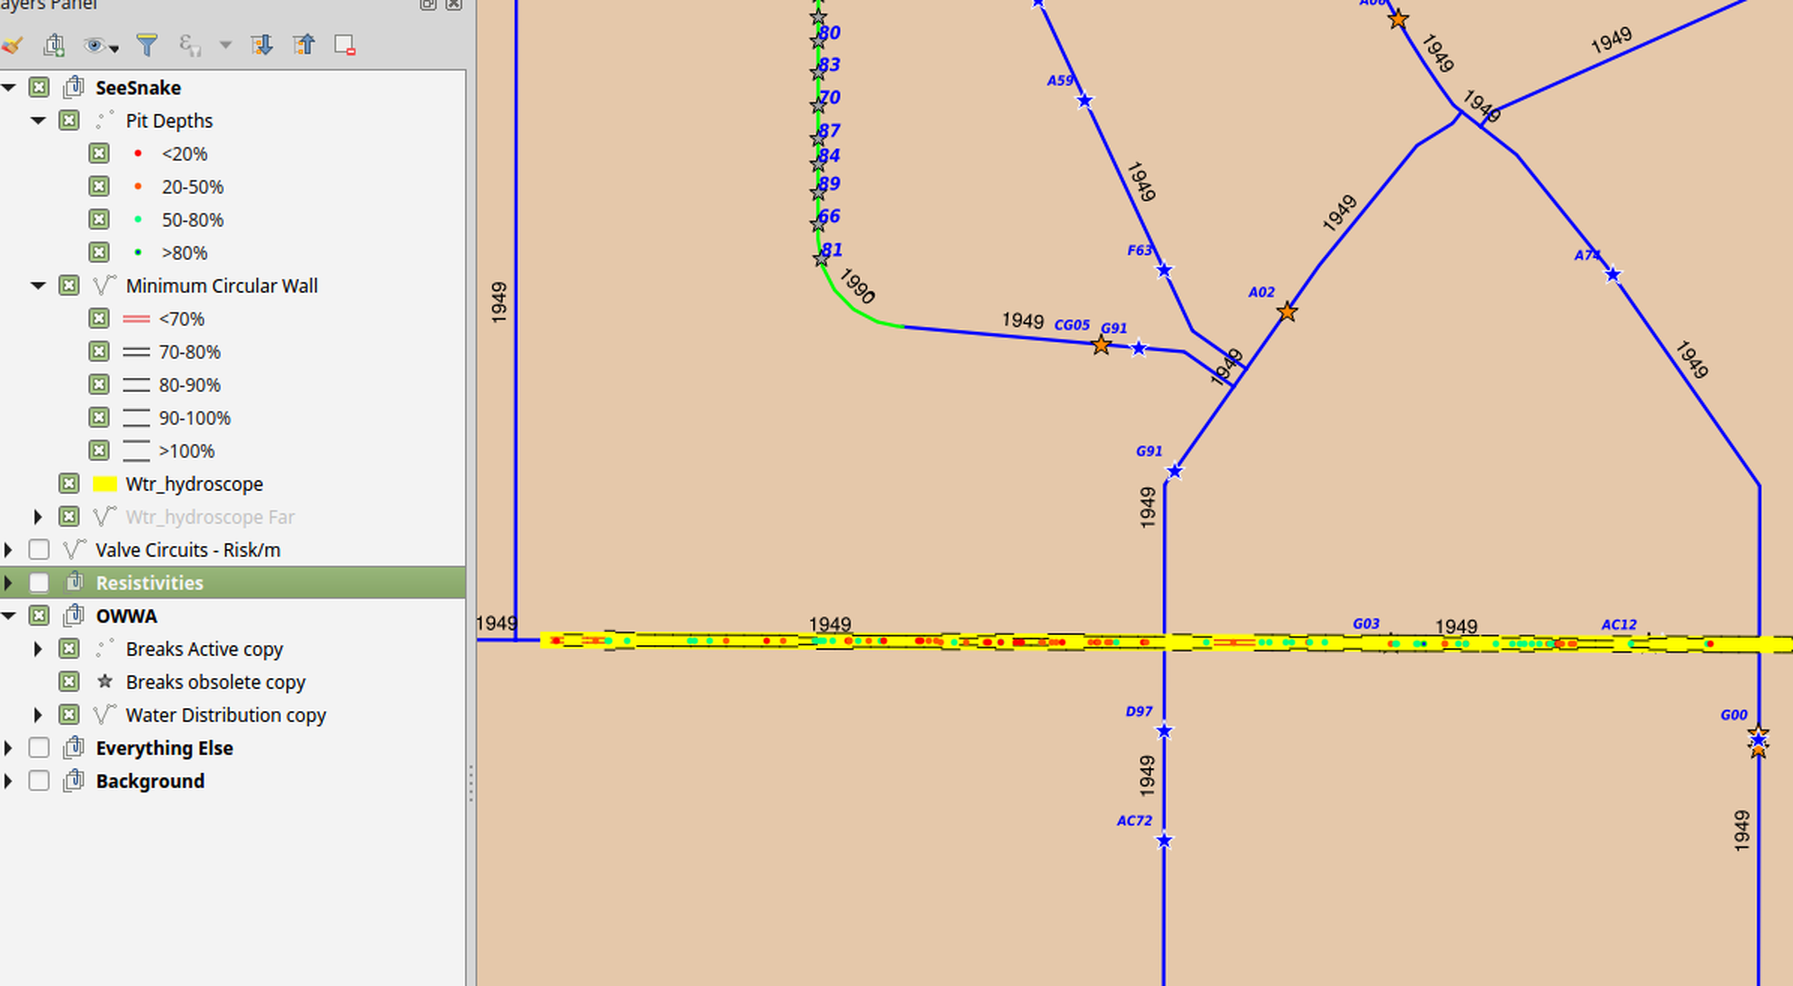 This neighbourhood not only gave me two replaced cluster cases, it also shows one that will happen in another several years or so.
This slide turns on the layer for the PICA SeeSnake, the inspection tool that gave us both the minimum wall thickness and the three deepest pits for each pipe length. Where the parallel lines are closer, the wall is thinner, with 70% remaining wall thickness a circular break waiting to happen - and the dots are the pits. Red dots are deep pits with less than 20% wall left, the green dots shallow pits.
With inspection data, you don't need to wait for several breaks to roughly infer where the corrosion clusters are; you can just see them. The bunch of red dots is several main breaks waiting to happen, if we let them. Since there's just the one cluster, we'll be able to do an opportunistic cut-in about ten metres long when the first main break gives us an excuse to dig in the cluster; anodes at either end, and this main may last to the late 21st century. I gambled and won, spending 10% of the replacement cost on an inspection, when the main had zero breaks; those nearby clusters had me wondering if there were more coming in the area, and sure enough, I found one. Joanna Line, my replacement, will spend another 20% of the cost of replacement on it soon enough, replacing maybe 30 metres, and we'll have still saved 70% to spend somewhere else.
fullscreen
 Secondly, I looked at when the breaks are clustered in time, but spread out across the whole main. This has been one of the biggest wins for rehabilitation through anode retrofit. When you get a sudden rash of breaks on a main, all over the place, the natural thing to do is panic and replace it. But the time-cluster is probably about a number of holes having already formed, and they all popped at once because of the repairs themselves, cycling the pressure and banging on the main. When you apply anodes at every repair, you may be stopping breaks for several metres on either side, and if you're putting those anodes all along the main, you may we put the fire out, especially if you add a pro-active anode retrofit of the entire length.
Where there's a past time-cluster, and now a new one forming, or I've even found two previous rounds on some old main, twenty years apart, it's certain the anodes are putting out the fire and you just have to do it again.
fullscreen
 In this case, we see a couple of breaks at once in 1966, then nothing for 20 straight years, when you get four breaks at once in 1986. But then it all stops until 2007, and then 2011 and 2013. I think this one is finally getting its anode retrofit, and it'll probably outlive me.
fullscreen
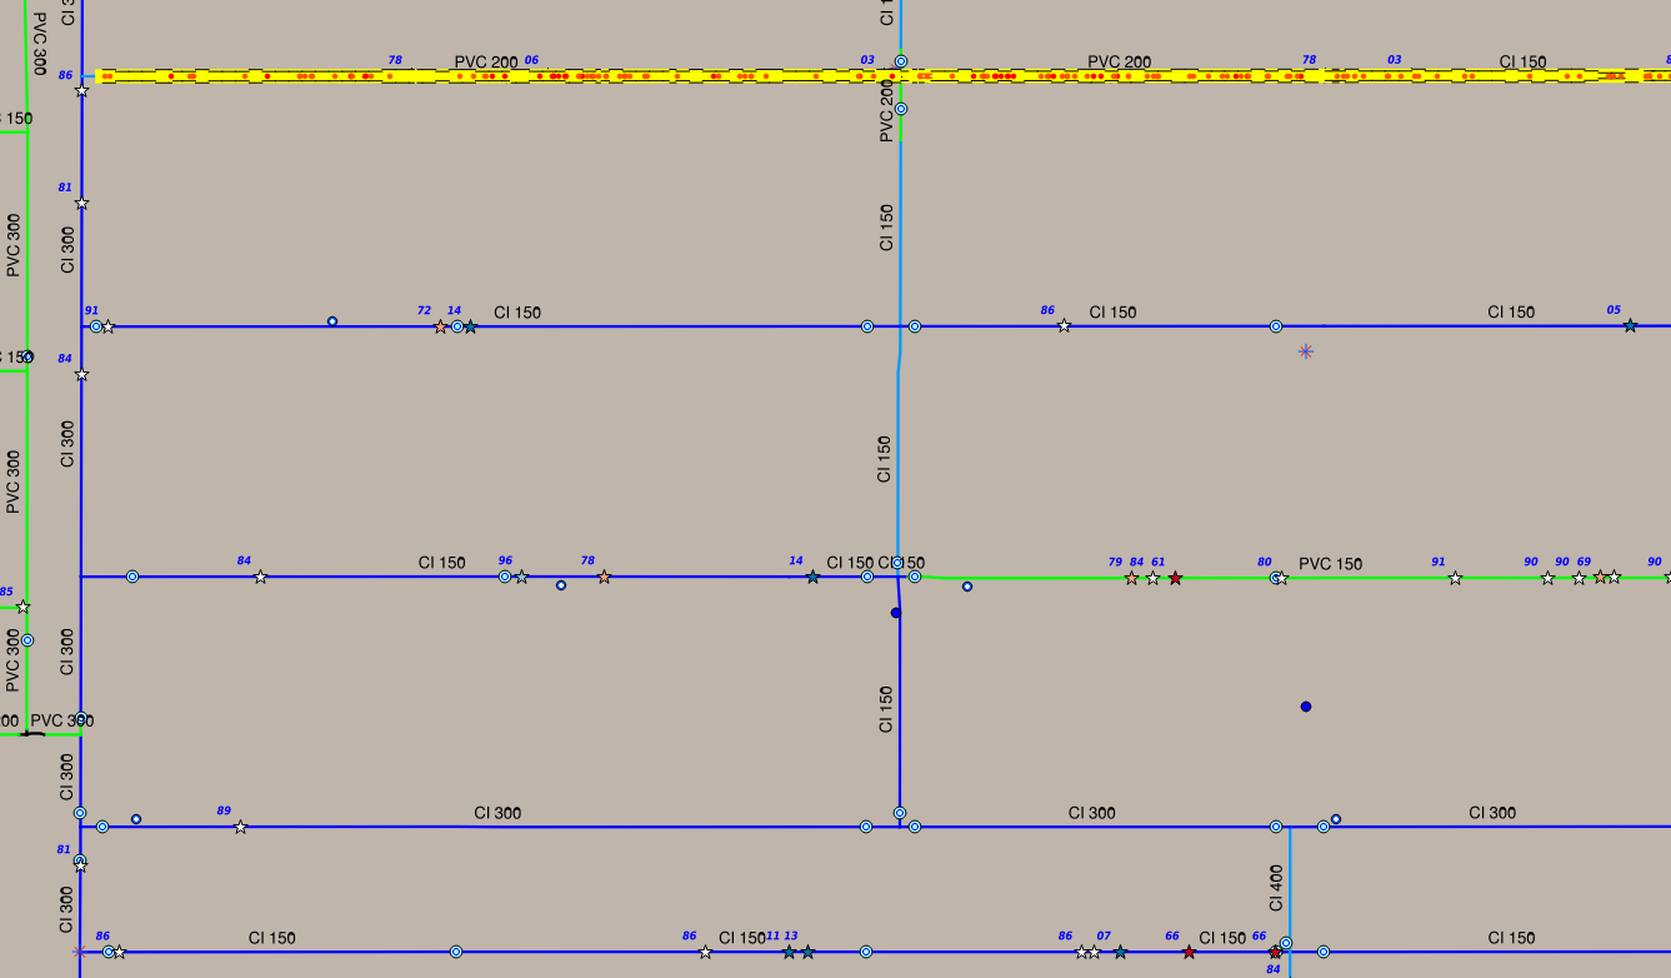 What's going on there? This map zooms out a bit, you can still see the last main at the bottom of this slide, but just four blocks north is a PICA SeeSnake run on a very similar 1920s Cast Iron main. If you'll recall, the two parallel black lines are far apart in the yellow stripe if the wall thickness is good, and it mostly is on this pipe. The problem that made us immediately replace this one with PVC is all those red dots -every one a pit with under 20% wall thickness left, basically holes waiting to pop. There were 102 of them waiting to go, spread all along the main. Because of inspection, we replaced it at four breaks, because another 20 were not preventable with anodes.
But notice how much plan yellow there is, as well - a lot of good pipe was thrown out with the bad. If even half those red dots had been green or even orange, we might have tried to save it.
fullscreen
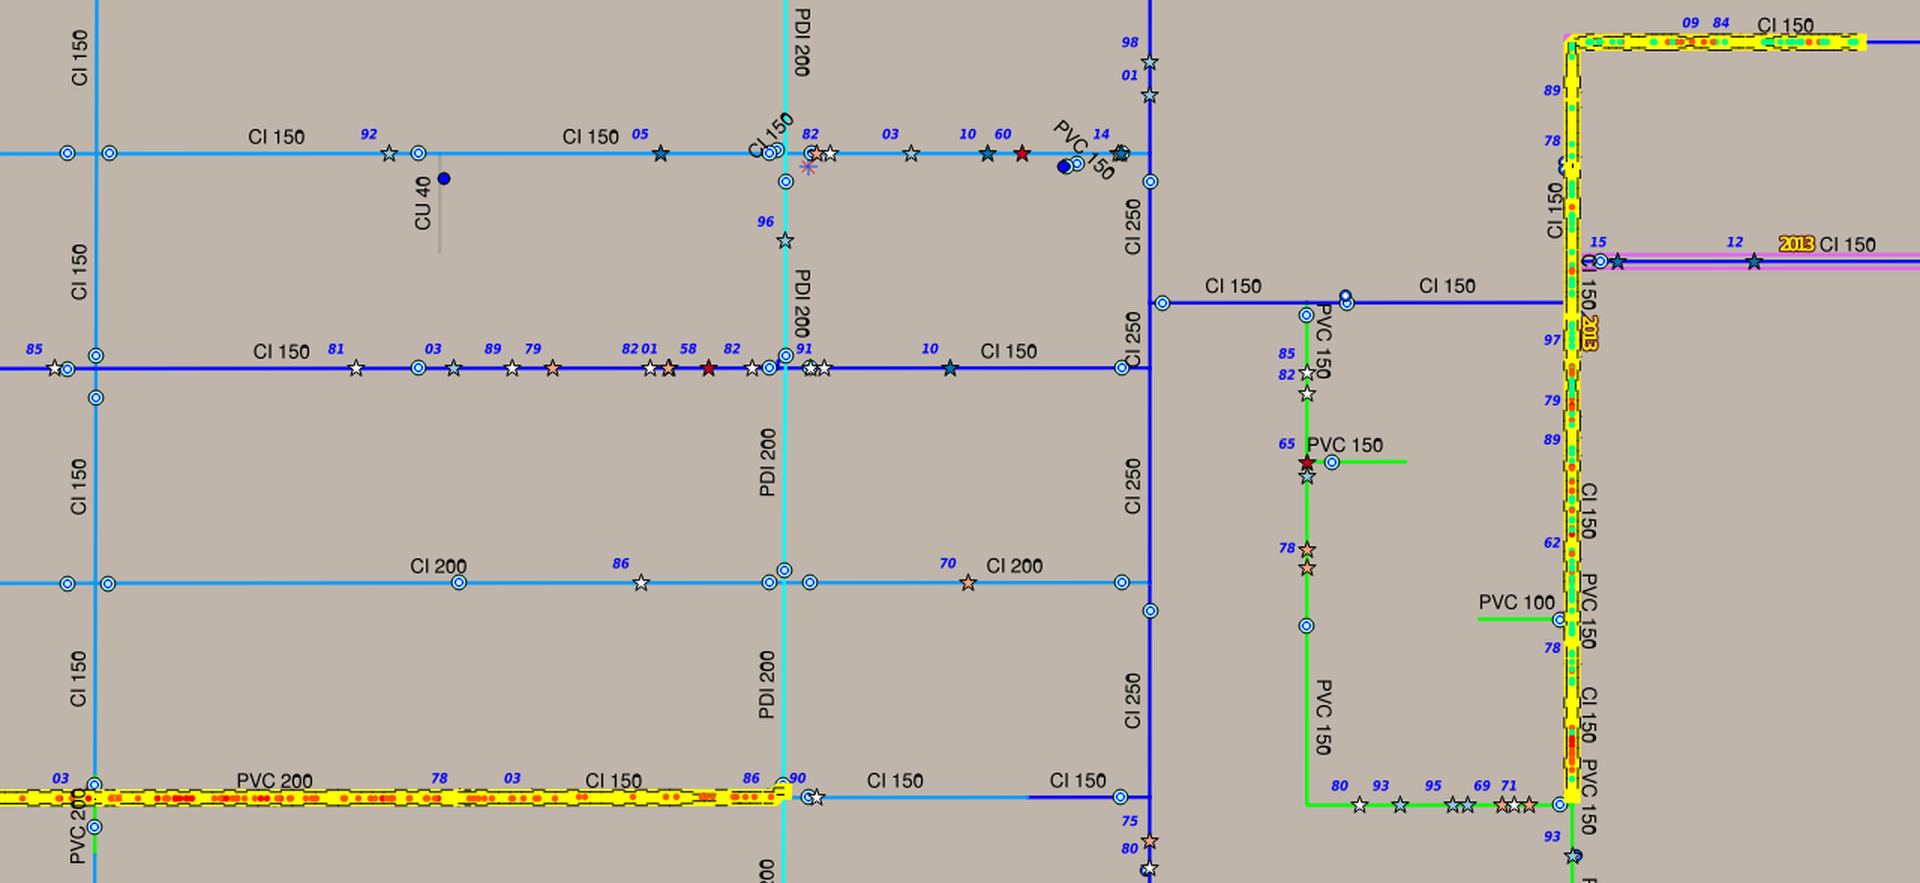 Going a few more blocks north and several blocks east, you can see the other nearby SeeSnake run, also on the same kind of main - and this one we saved with anode retrofit. Recalling that the green dots are very shallow pits - the main had been there for 70 years and most of the pits went barely 20% in - we knew that th nine breaks it had suffered - three more than the other SeeSnake'd main we'd just replaced - were just about all the break it had in it! They'd already popped, except this bunch of red dots down here may still stage a break or two - but we can take that, better than we can take four hundred thousand dollars of replacement to avoid two breaks. So we retrofitted in 2013.
I'm afraid this does show how my little chart of cluster rules of thumb is still pretty lame, compared to having inspection data. It's a set of rules for guessing the future from the gross effects of defects; but the inspection data gives you the defects themselves, removing most of the guessing.
fullscreen
 Here's an example of just one time-cluster, spread out across the main, that we again bet on anodes and won. I like this one, because it's an unusual valve circuit, the main spanning three city blocks. After one break in 87 and another in 1990, it suddenly has this burst of 5 breaks from 1994 through 1997. But we were drastically reducing our main replacement program at the time, and it got missed - then it had no breaks in 98 and 99, we decided to try out our just-invented anode retrofit crew on it in 2000, and it now hasn't had a break since. Another half-million saved.
fullscreen
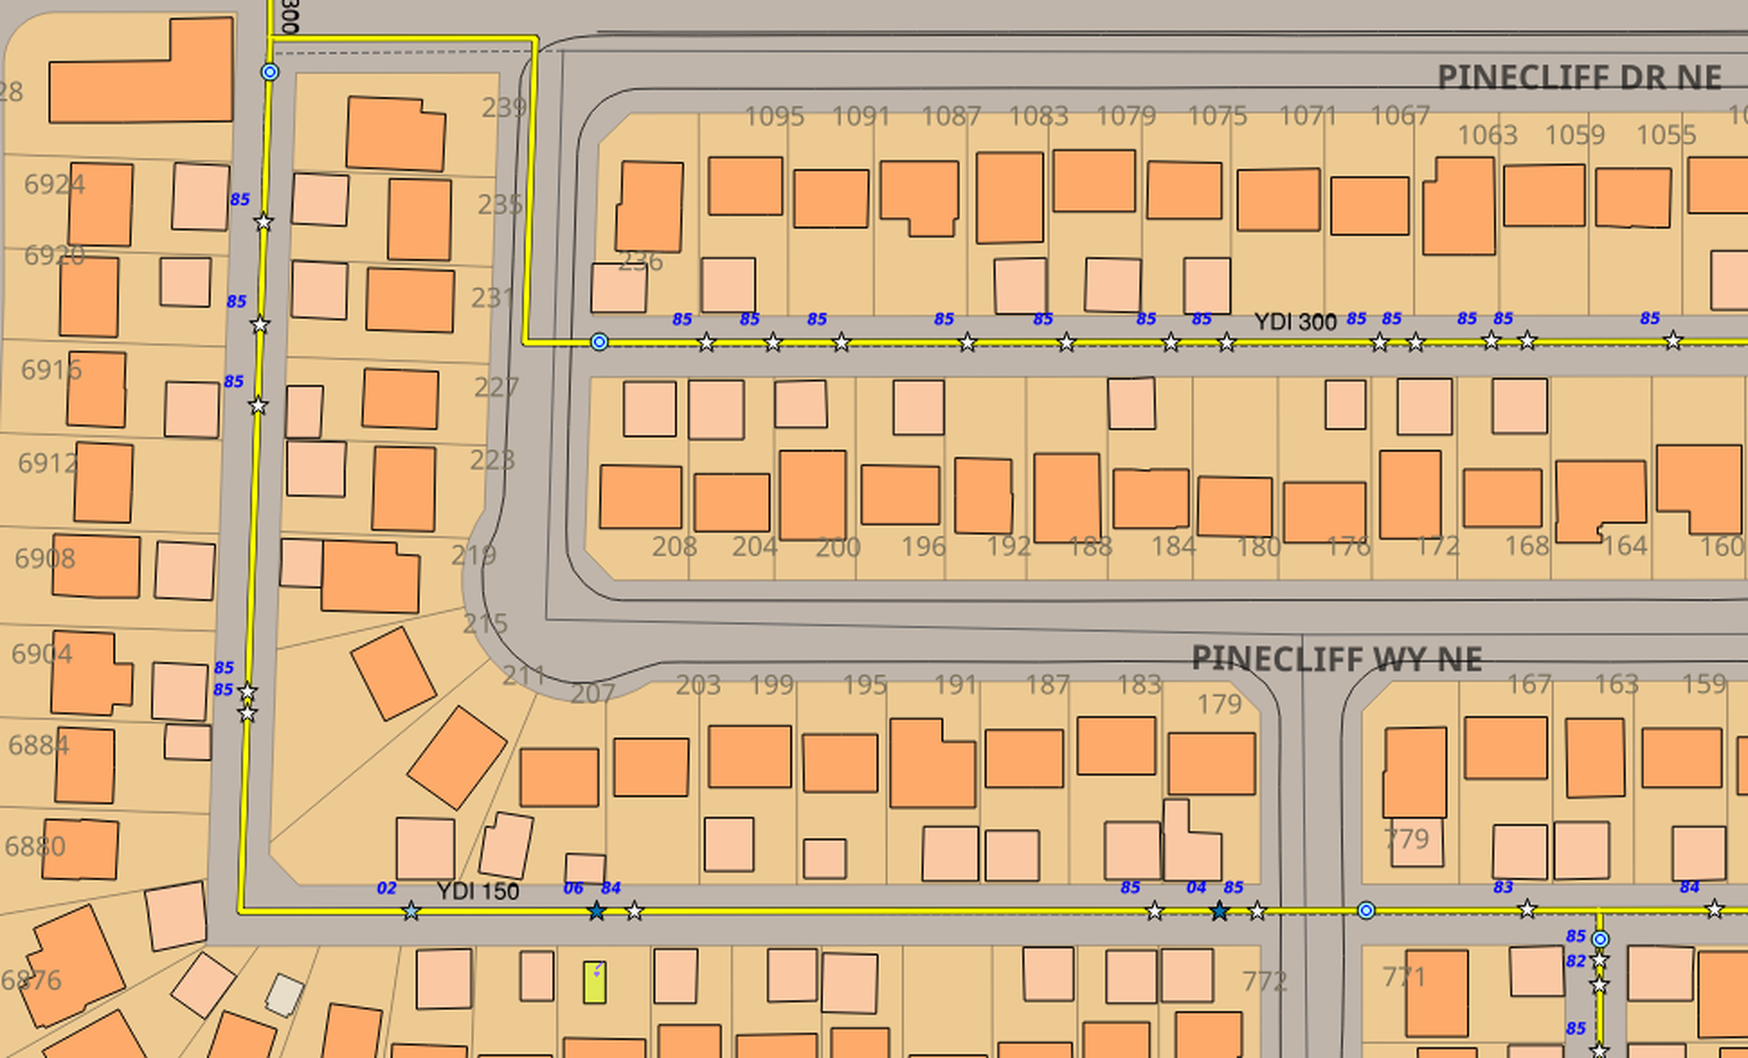 I just want to throw in something for the sake of advertising anodes again. It really shook me to learn recently that Winnipeg, with some of the blackest soil and worst corrosion in the nation, doesn't use them. For me, that's like learning their hospitals have no MRI machines. One of the reasons we know anodes work in Calgary is that YDI stuff. Here are two mid-1970s YDI mains that simply exploded with breaks in 1985, about ten years after they went in. It was clear their anodes had either been mis-installed or the connections broke. So we applied anodes at once and you see no late 80's or any 1990s breaks. Then the first few appeared again in 2004, when those 1985 anodes hit 20 years old. We put on more and the breaks stopped again. What's surprising is how quickly it works.
fullscreen
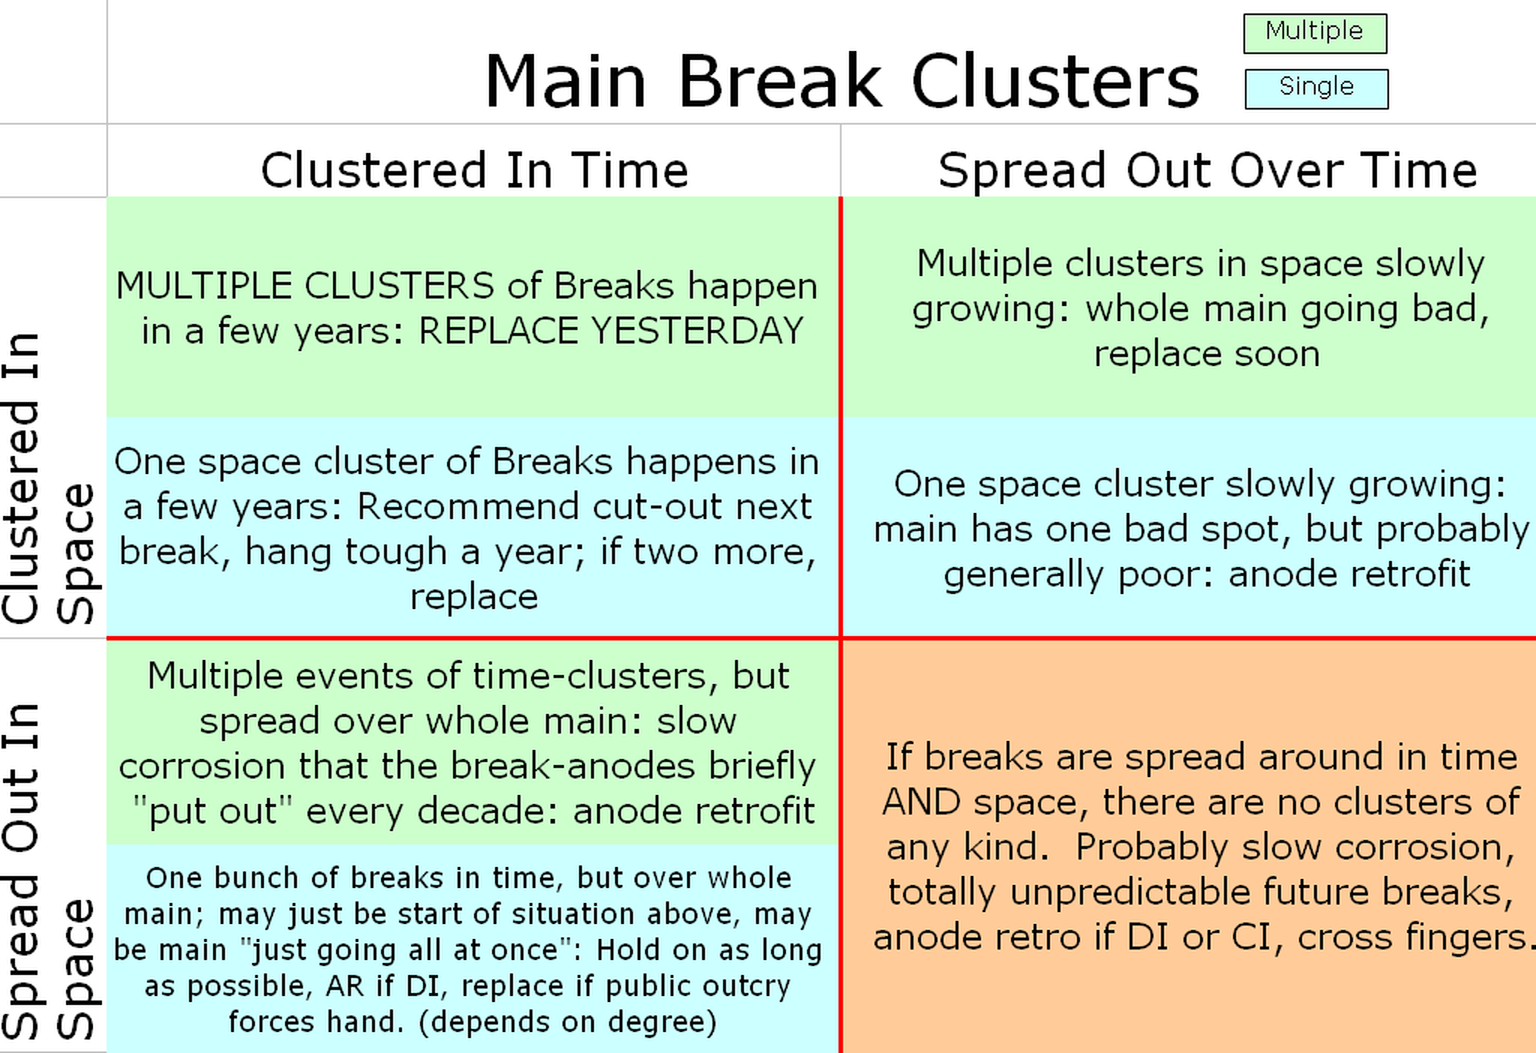 I'm skipping the lower-right corner which is when you have no clustering at all in time or space - breaks years apart spread across the main; for us, that's an obvious if low-priority anode retrofit; most people would do nothing unless they have the really terrible rule of replacing at a certain number of total breaks. Once you prove that only recent breaks predict future ones, that becomes crazy.
The last case we'll go over with examples is where the cluster is close in space but spread out over time. Since the problem is small in area, you can replace just a portion and anode-retrofit the rest.
fullscreen
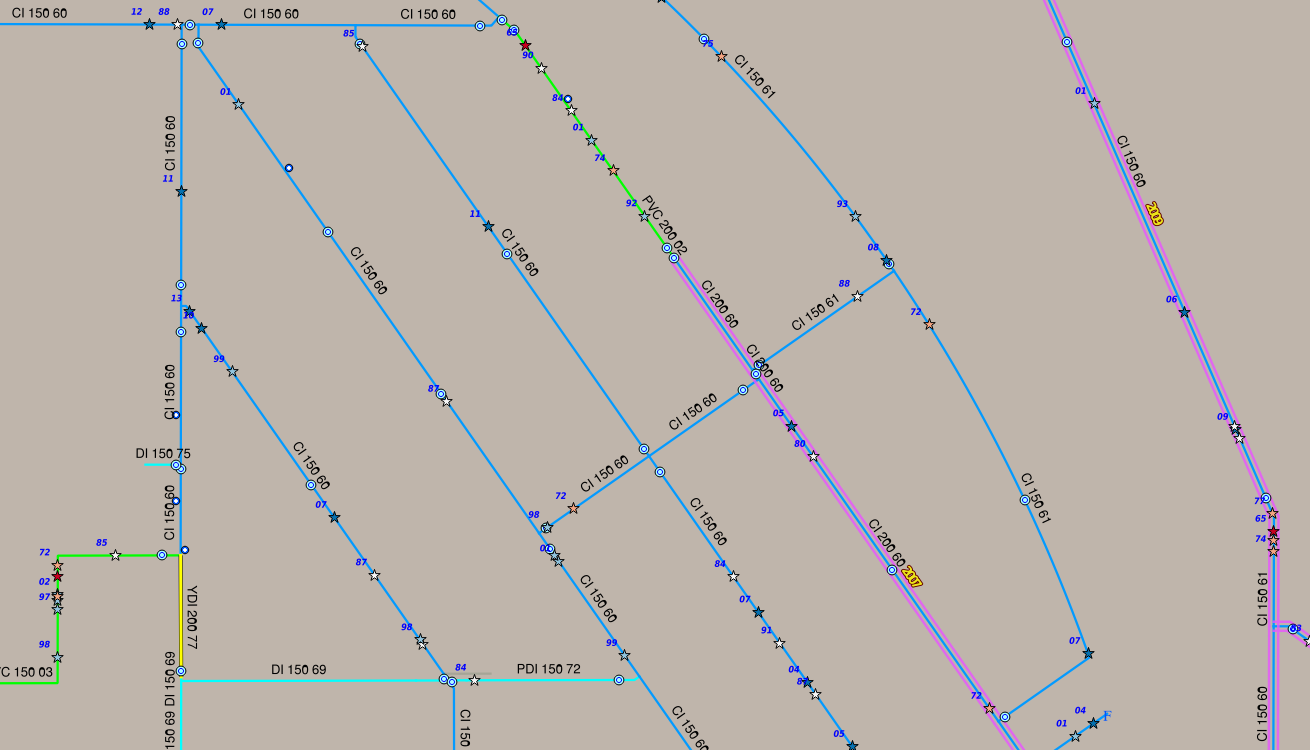 You see a case here where the breaks started in 1974 and came several years apart until 2001 when we put a SeeSnake on it. What we saw there made us cut in this extra valve and replace just half a block, the cluster was so concentrated. Before I flip to that view, notice this main two blocks west, where it had just started to have a few breaks at the same time.
fullscreen
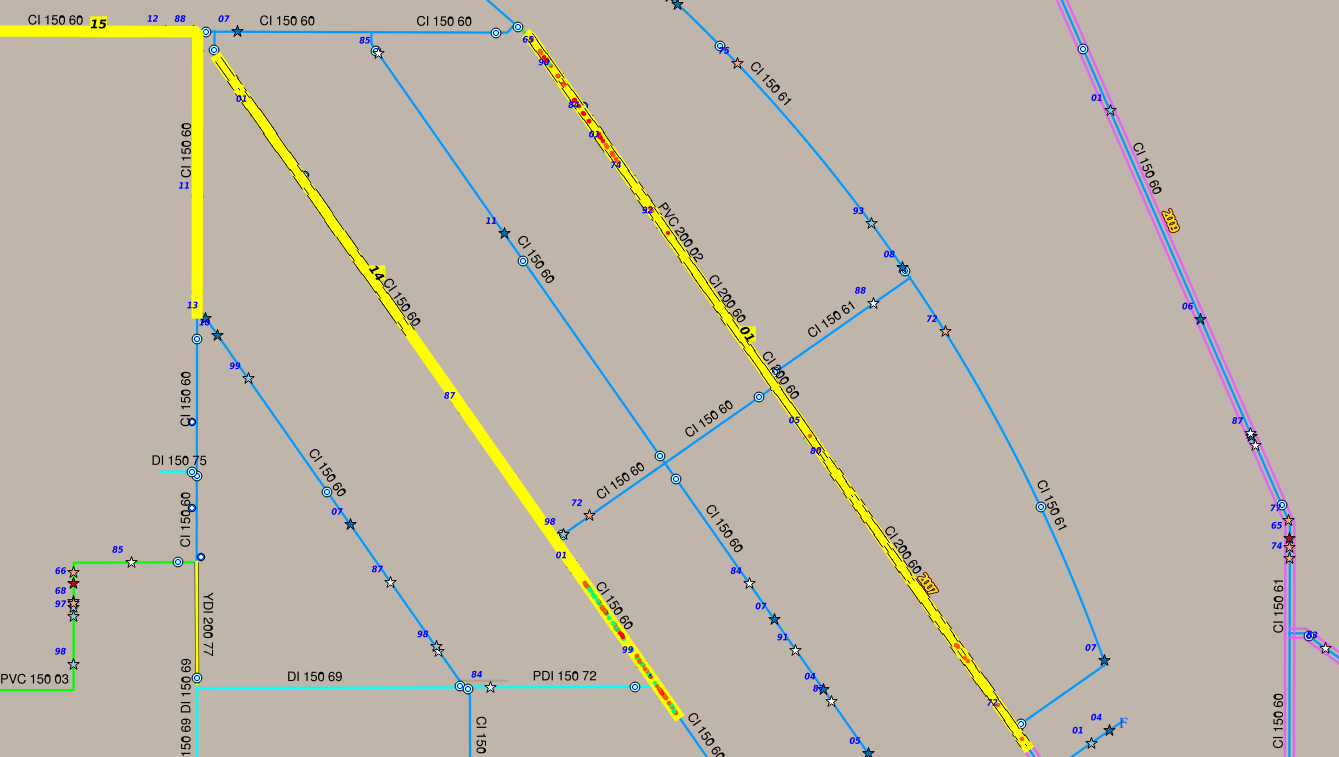 Now it's plain: there's a blob of hot soil at the north end, eating the main, but no pits at all on the next block and a half. So we were able to save those blocks, which was well worth a short replacement job and an extra valve.
And notice that when we got a SeeSnake around to the main two blocks west just in 2014, we found that main, too, has just one cluster of pits at the south end. We'll be able to save most of that, or even all of it if the anodes work down there.
I have to admit that it took more courage than I had to replace only half a block if I didn't have a SeeSnake run to assure me the rest of the block was clean; once you've had inspection data, it kind of spoils you.
fullscreen
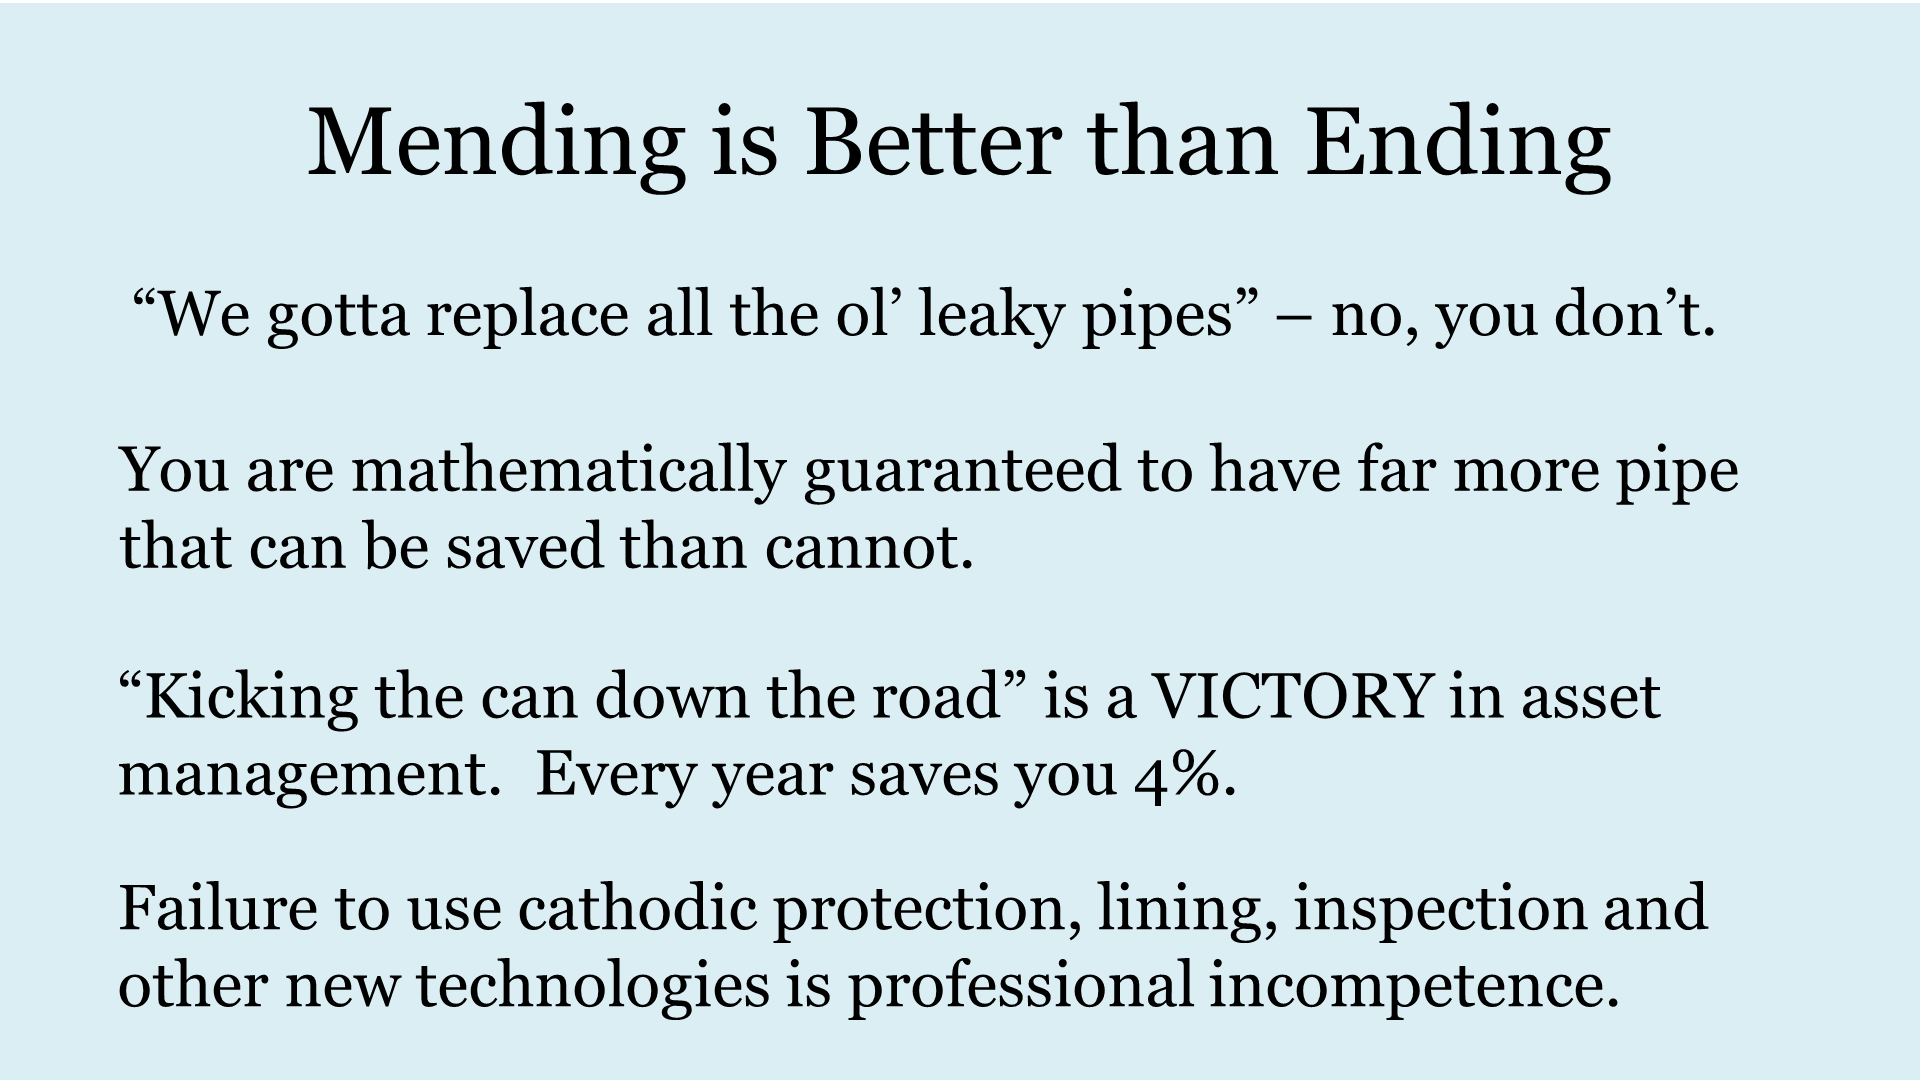 The only think more depressing than hearing that Winnipeg wasn't using anodes was a comment made by a construction guy in Los Angeles this year; he said he wasn't sure why they were doing all this inspection since "We gotta replace all the ol' leaky pipes anyway". Buddy, the industry loses over 10% of the water per year; they are ALL "old leaky pipes" and you can only replace 1% a year - the question is which 1%. The power law tells us that there's a lot more pipe that we can delay the replacement of with anodes, liners, and short cut-in replacements during repairs, than pipe we have to replace. And just delaying replacement is the whole victory of asset management - nothing lasts forever, but just like human beings, we'd like them to last as long as possible. It would be criminal for a doctor to write you off when you're just a little bit sick, and today, it's just as criminal for an engineer to give up on infrastructure when new technologies have given us so many cheaper options. Use them, or lose...money! Thanks.
fullscreen